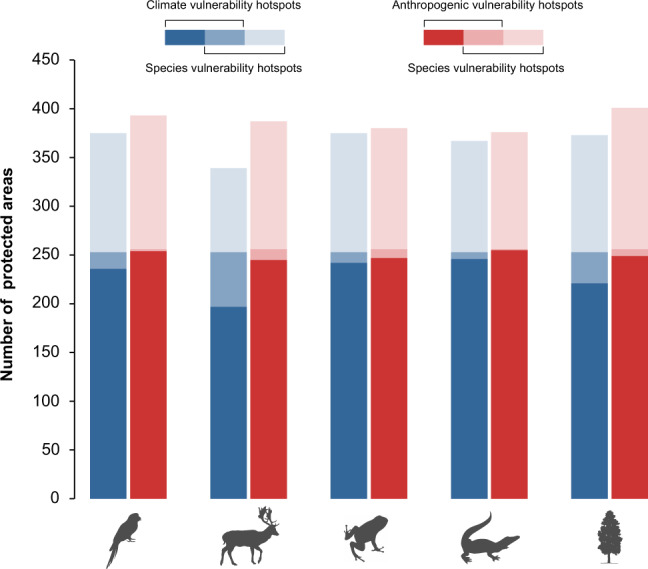
Fig. 3. Overlap of species vulnerability hotspots of five species groups with climate and anthropogenic vulnerability hotspots.

The hotspots were identified by randomizing respective vulnerability scores of each protected area (PA) 1000 times and keeping a track of where the observed value was greater than the randomized value. If the observed value was within the highest 5% of the null distribution (one-tailed test) for that PA (i.e., at least 950 times higher than the 1000 randomized value), it was identified as hotspots.
