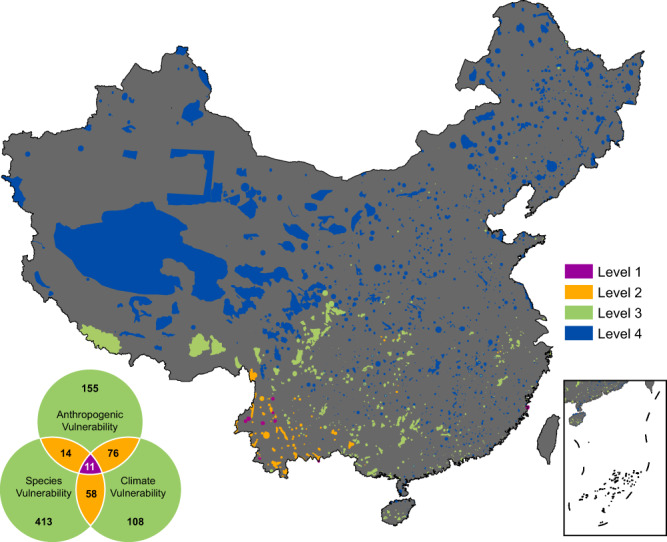
Fig. 4. Classification of Chinese protected areas (PAs) based on three vulnerability indices: climate vulnerability, anthropogenic vulnerability, and species vulnerability.

The PAs in magenta represents the hotspots identified by all three indices (Level 1), the PAs in orange represents the hotspots identified by two indices (Level 2) and the PAs in green represents the hotspots identified by only one index (Level 3). Protected areas that lie outside the hotspots of these three indices are shown in blue (Level 4). Numbers in the Venn diagram are the total number of protected areas in each category.
