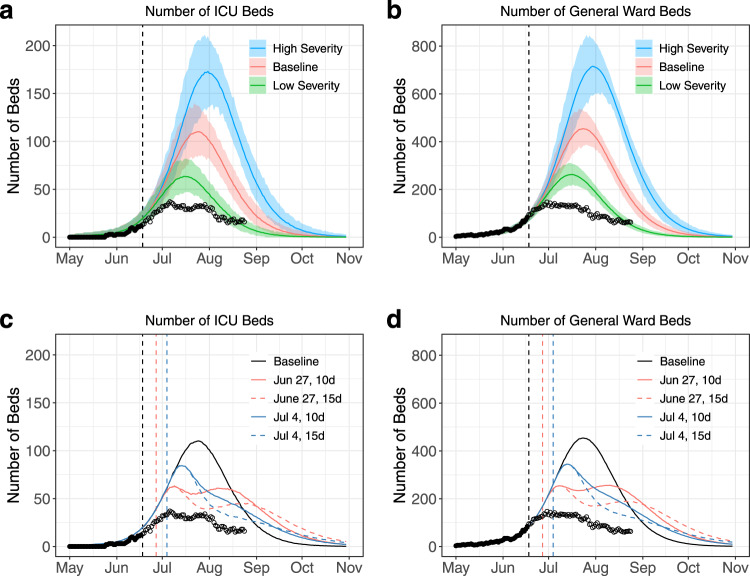
Fig. 2. Analyses made on June 18th 2020 describing a scenario with no change in transmission rates and the impact of a short-term lockdown.
a, b Projections for the number of ICU and general ward beds required under different severity scenarios (baseline in red, low severity in green, high severity in blue). Solid lines indicate model posterior means while colour areas indicate 95% credible intervals. c and d Projections for the average number of ICU and general ward beds required under different territory-wide lockdown scenarios (black represents our baseline model, red represents lockdowns starting on June 27th, blue represents lockdowns starting on July 4th, solid lines correspond to lockdowns lasting for 10 days, while dashed lines correspond to lockdowns lasting for 15 days). In all panels, black dots indicate data used to calibrate the models, while empty circles denote data not available at the time of the analyses. The black dashed line in all panels indicates the date of the analyses (June 18th). The coloured dashed lines in panels c and d indicate the start of the simulated lockdown (red for June 27th and blue for July 4th).

