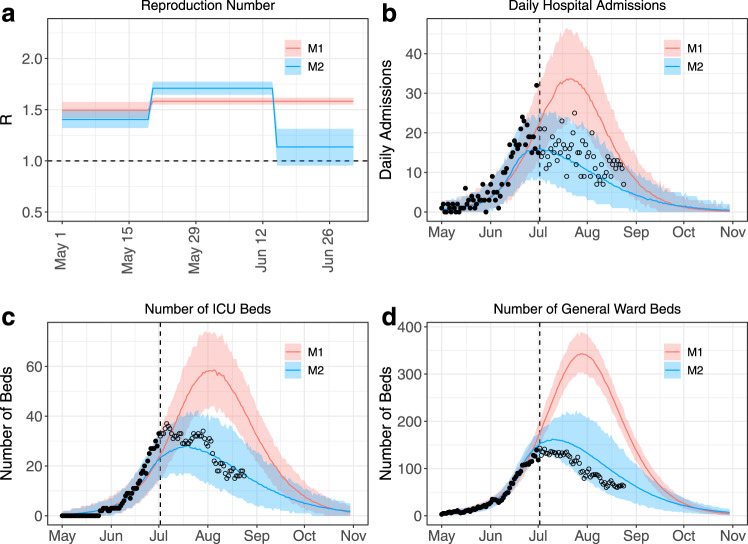
Fig. 3. Analyses made on July 2nd 2020 evaluating the impact of control measures implemented in French Guiana on transmission and healthcare demand.
a Estimated reproduction number through time. The horizontal dashed line indicates a reproduction number R = 1. b, d Projections for the number of daily hospital admissions (b) and ICU (c) and general ward (d) beds. Solid lines indicate model posterior means while colour areas indicate 95% credible intervals. Red is used for model M1 (one change point for the transmission rate), while blue is used for model M2 (two change points for the transmission rate). In all panels black dots indicate data used to calibrate the models, while empty circles denote data not available at the time of the analyses. The dashed line panels b–d indicates the date of the analyses (July 2nd).

