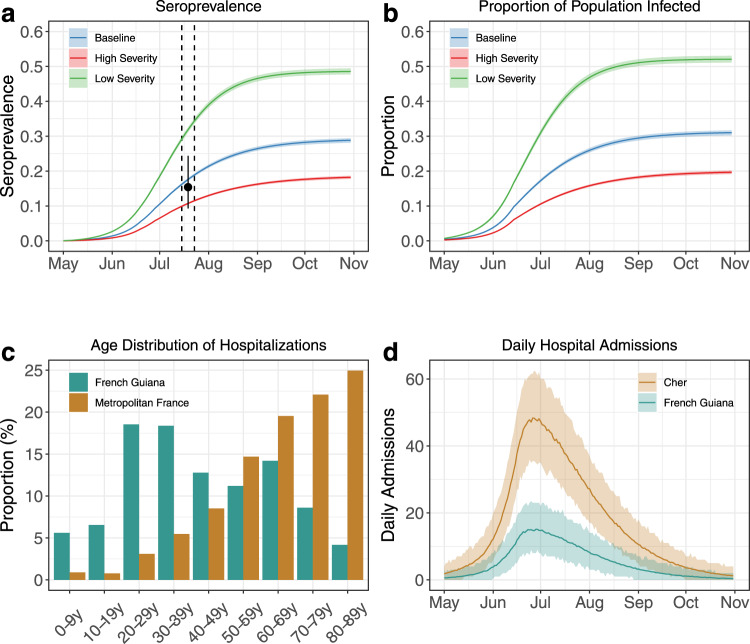
Fig. 4. Analyses made on 25 August 2020.
a Projections for the seroprevalence measured with the Euroimmun assay. Solid lines indicate model posterior means while colour areas indicate 95% credible intervals. The black dot and vertical bar indicate seroprevalence estimates from13 between 15 and 23 July 2020 (dashed lines). b Projections for the proportion infected. Solid lines indicate model posterior means while colour areas indicate 95% credible intervals. c Age distribution of hospitalized cases in Metropolitan France (brown) and French Guiana (green). d Simulated numbers of hospital admissions in the Cher department (Metropolitan France, brown) compared to those obtained for French Guiana (green). Solid lines indicate model posterior means while colour areas indicate 95% credible intervals.

