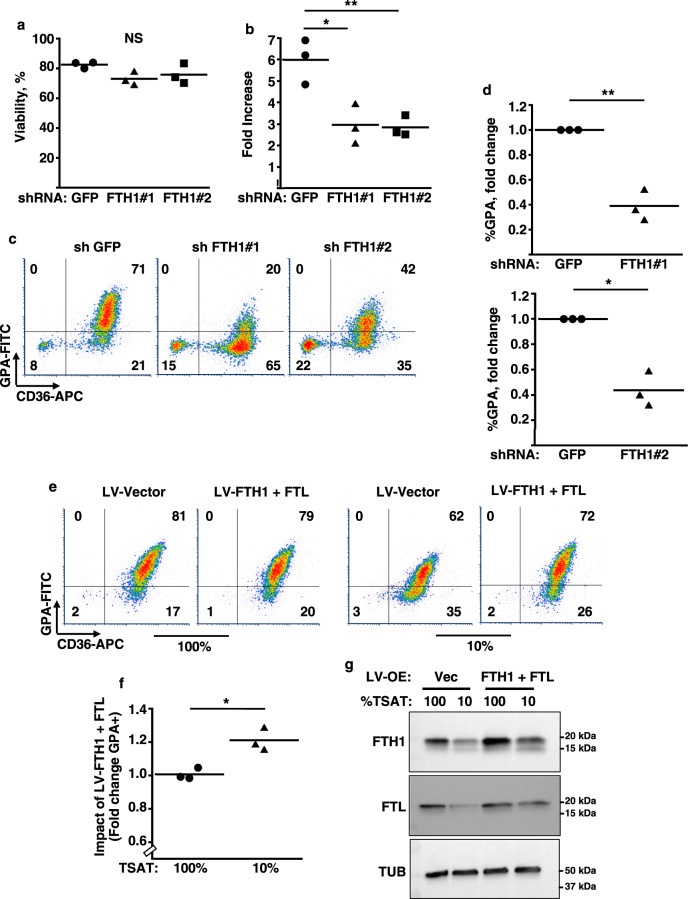
Fig. 4. Implication of FTH1 in the erythroid iron restriction response.
a, b Influence of FTH1 levels on viability and proliferation. Graphs: mean % viable cells and fold increases in cell number for human CD34+ progenitors transduced with lentiviral shRNA vectors targeting either green fluorescent protein (GFP) or ferritin heavy chain (FTH1), and cultured 4 days in iron-replete erythroid medium. Error bars, SEM; n = 3 biologically independent experiments; *, **P = 0.011, 0.009, one-way ANOVA with Tukey post hoc. NS not significant. GPA glycophorin A. c Influence of FTH1 levels on erythroid differentiation as determined by flow cytometry on cells treated as in a. d Mean fold change in GPA+ cells associated with lentiviral transductions and 4 days culture in iron-replete erythroid medium. Error bars, SEM; n = 3 independent experiments; *, **P = 0.019, 0.013, unpaired two-sided Student’s t test. Note: most experiments separately assessed FTH1#1 and FTH1#2. e Distinct consequences of ferritin enforcement in iron-replete versus iron-restricted progenitors. Flow cytometry analysis of CD34+ progenitors transduced with lentiviral (LV) expression vectors for ferritin heavy (FTH1) and light (FTL) chains followed by 4 days culture in iron-replete (100% TSAT) or deficient (10% TSAT) erythroid medium. f Mean fold change in GPA+ cells associated with ferritin enforcement in cells cultured as in e. Error bars, SEM; n = 3 independent experiments; *P = 0.02, unpaired two-sided Student’s t test. g Ferritin levels in cells transduced and cultured as in e and f, as assessed by immunoblot. LV-OE lentiviral overexpression; Vec vector. Representative results from three independent experiments. See also Supplementary Fig. 8. Source data are provided as a Source data file.

