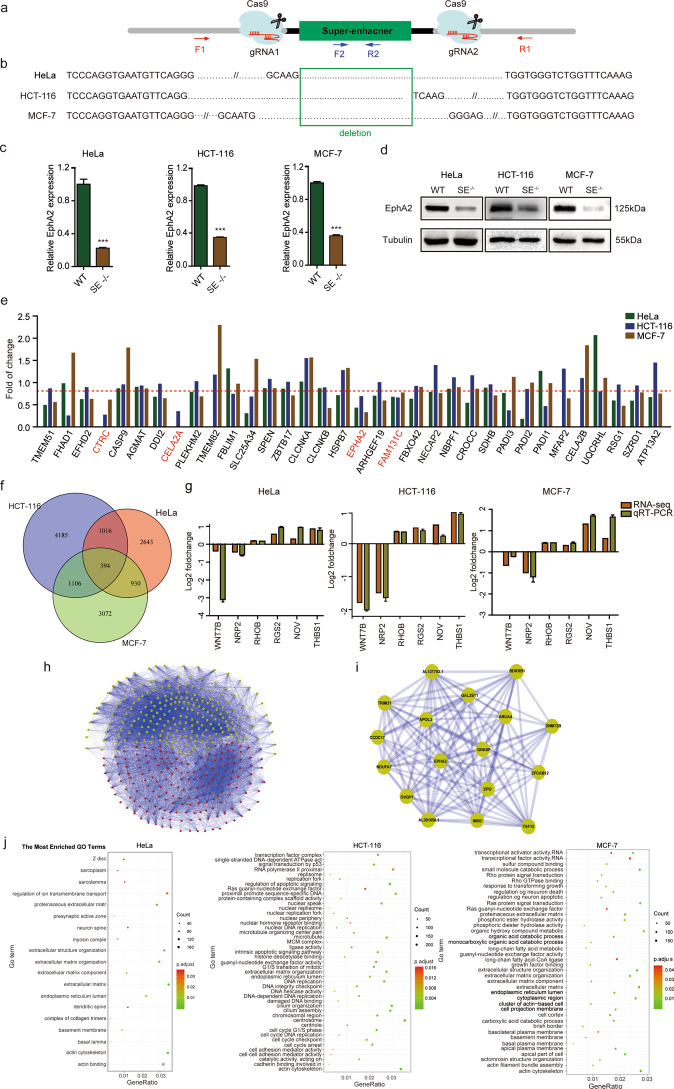
Fig. 2. CRISPR/Cas9-mediated deletion of EphA2-SE and RNA-seq of EphA2-SE.
a Schematic of CRISPR/Cas9-mediated deletion of the super-enhancer. b The deletion clones of the super-enhancer were identified through sequencing results. c The expression level of EphA2 in EphA2-SE-knockout cells was significantly decreased by qRT-PCR and d western blotting. Relative expression level was normalized by GAPDH. Error bars, mean ± SD. n = 3. p values were calculated using t-test. ***p < 0.001. e RNA-seq analyzes the gene expression of EphA2-SE within ~1 Mb. f Venn diagram of up-regulated genes and downregulated genes in HeLa, HCT-116 and MCF-7 cells (fold change >1.2 or <0.83). g Validation of RNA-seq analysis in EphA2-SE (SE−/−) clones. h Co-expression network map of 394 public differentially expressed genes. i A module with EphA2 as the core in co-expression network. j GO enrichment analysis of differentially expressed genes.

