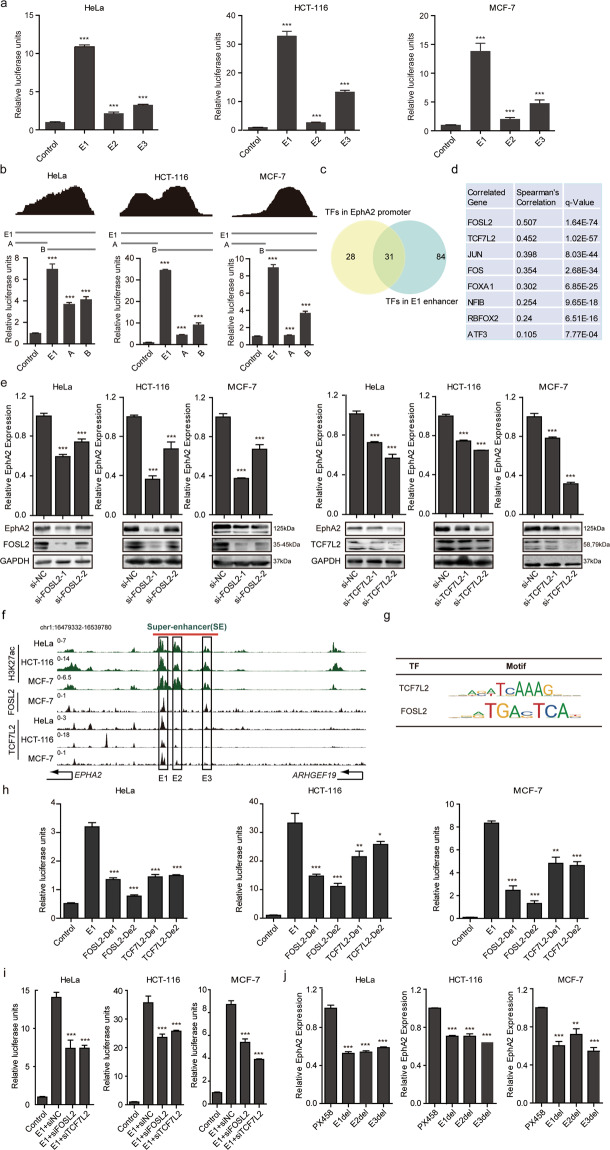
Fig. 3. Activities of EphA2-SE constituents and transcription factors that bind to the E1 enhancer.
a The enhancer activity of E1-E3 within the EphA2-SE region was measured by dual-luciferase reporter assays in HeLa, HCT-116 and MCF-7 cells, respectively. b Top, transcription factor density. The abscissa represents the E1 component enhancer region, and the ordinate represents the number of transcription factors. Bottom, the enhancer activity of the two fragments of E1 was measured. c Veen displays transcription factors that bind to both the E1 component enhancer and the EphA2 core promoter region. d Correlation analysis of 31 transcription factors bound in the E1 enhancer and core promoter regions. We use the Cbioportal website (https://www.cbioportal.org/) to retrieve data from the cell lines (Broad 2019, Novartis/Broad Nature 2012 and NCI Cancer Res 2012) databases. e The expression of EphA2 was detected by qRT-PCR and western blotting after knocking down FOSL2 and TCF7L2. f ChIP-seq profiles of FOSL2 and TCF7L2 transcription factors in E1-E3 component enhancers. g The motifs of FOSL2 and TCF7L2. h E1 enhancer activity decreases after the binding sites of FOSL2 and TCF7L2 are deleted. i The E1 enhancer activity was reduced after adding siFOSL2 and siTCF7L2, respectively. j The expression of EphA2 after partial deletion of E1-E3 component enhancers. Error bars, mean ± SD. n = 3. p values were calculated using t-test. *p < 0.05, **p < 0.01, ***p < 0.001.

