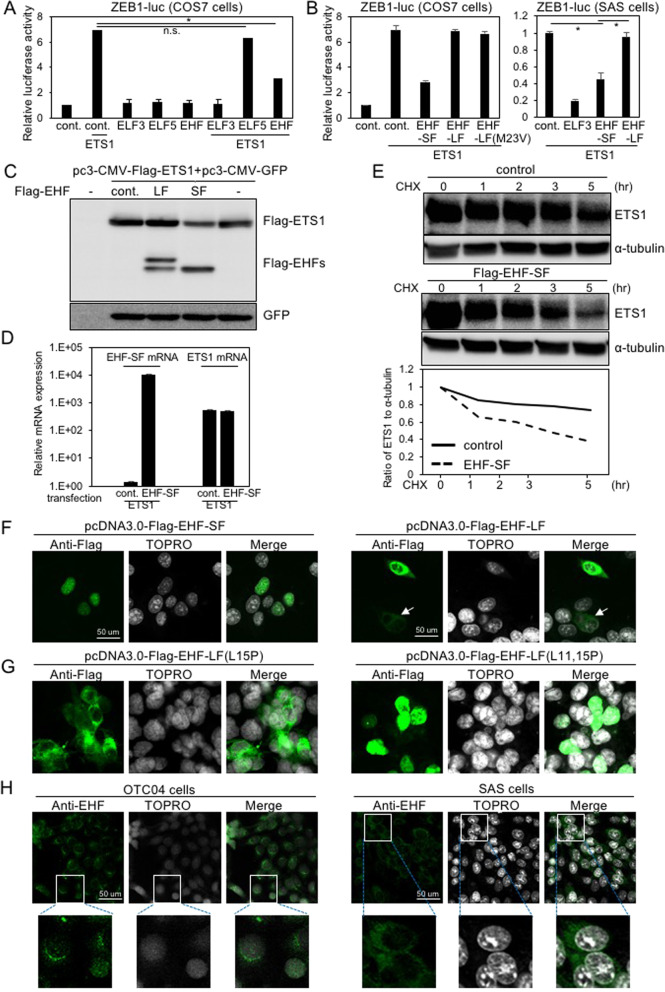
Fig. 3. Inhibitory effects of EHF variants on ZEB1 promoter activity.
A and B ZEB1 promoter activities were determined by luciferase assays after transfection with control vector (cont.) or the indicated plasmids. Luciferase activity of cells transfected with the control vector was indicated as “1.” Each value represents the mean ± s.d. of triplicate determinations from a representative experiment. Similar results were obtained in at least three independent experiments. p values were determined by Student’s t-test. *p < 0.01; n.s., not significant. (C and D) COS7 cells were transfected with the indicated plasmids, followed by IB (C) and RT-qPCR (D) to determine the levels of transfected genes. Ectopic EHF-SF mRNA levels of cells transfected with ETS1 alone was indicated as “1” (D). E COS7 cells pre-transfected with flag-tagged ETS1 were further transfected with either control vector or flag-EHF-SF plasmid, and treated with cycloheximide (CHX) for the indicated time, followed by IB. The ratio of ETS1 to α-tubulin was determined by densitometric analysis and shown at the bottom. (F and G) COS7 cells were transfected with the indicated plasmids followed by immunofluorescence analysis using an anti-flag antibody. Arrow indicates cells with low expression of flag-EHF-LF. H Subcellular localization of endogenous EHF was determined by anti-EHF antibody in HNSCC OTC04 and SAS cells. High magnification is shown in bottom panels.

