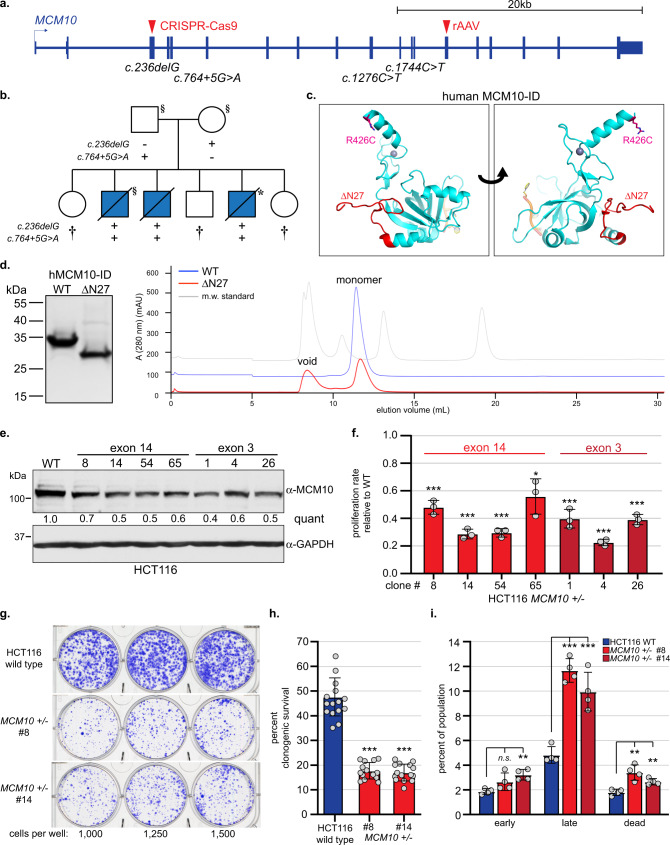
Fig. 1. Modeling MCM10 patient-associated variants.
a MCM10 schematic indicating NKD- (c.1276 C > T;c.1744C > T) and RCM-associated (c.236delG;c.764 + 5 G > A) variants and exons targeted using CRISPR-Cas9 (exon 3) or rAAV (exon14). b Pedigree and segregation of MCM10 variants in the RCM family. Blue shading indicates fetal RCM. Individuals that underwent exome (§) or genome (*) sequencing are indicated. Clinically unaffected children that are not carriers of both pathogenic variants (†) are indicated (carrier status of minors not disclosed). c Model of hMCM10-ID bound to single-stranded DNA, based on Xenopus laevis MCM10-ID (Protein Data Bank codes 3EBE16 [https://www.ncbi.nlm.nih.gov/Structure/pdb/3EBE] and 3H1574 [https://www.ncbi.nlm.nih.gov/Structure/pdb/3H15]). Locations of the R426C (pink) and ΔN27 (red) variants and the zinc ion (gray sphere) are shown. d (Left) Coomassie blue-stained gel of WT and ΔN27 hMCM10-ID. (Right) Chromatography profiles of WT and ΔN27 hMCM10-ID. The molecular weight standard (gray) included thyroglobulin (670 kDa), γ-globulin (158 kDa), ovalbumin (44 kDa), myoglobin (17 kDa), and vitamin B12 (1.3 kDa). Trace profiles for WT and the molecular weight standard are offset on the y-axis for display purposes. e Western blot for MCM10 with GAPDH as a loading control. Quantification of MCM10 levels normalized to loading control, relative to wild type is indicated. f Average proliferation rate in MCM10+/- cells normalized to wild type. For each cell line n = 6 replicates, with average values for biological replicates indicated (gray circles). g Comparison of clonogenic survival of HCT116 wild type (top) and MCM10+/- cells (middle/bottom). Cells plated per well are noted. h Average percentage clonogenic survival in HCT116 wild type (blue) and MCM10+/- cells (red), n = 15 replicates. Individual data points are indicated (gray circles). i Average percentage of early apoptotic, late apoptotic, or dead cells. Wild type (blue) and clonal MCM10+/- cell lines (red) are shown with n = 4 biological replicates. Individual data points are indicated (gray circles). Error is indicated in f, h, and i as SD and significance was calculated using an unpaired, two-tailed student’s t-test with *<0.05; **<0.01, ***<0.001. Source data for panels d, e, f, h, and i, including relevant exact p-values, are provided in the Source Data file.

