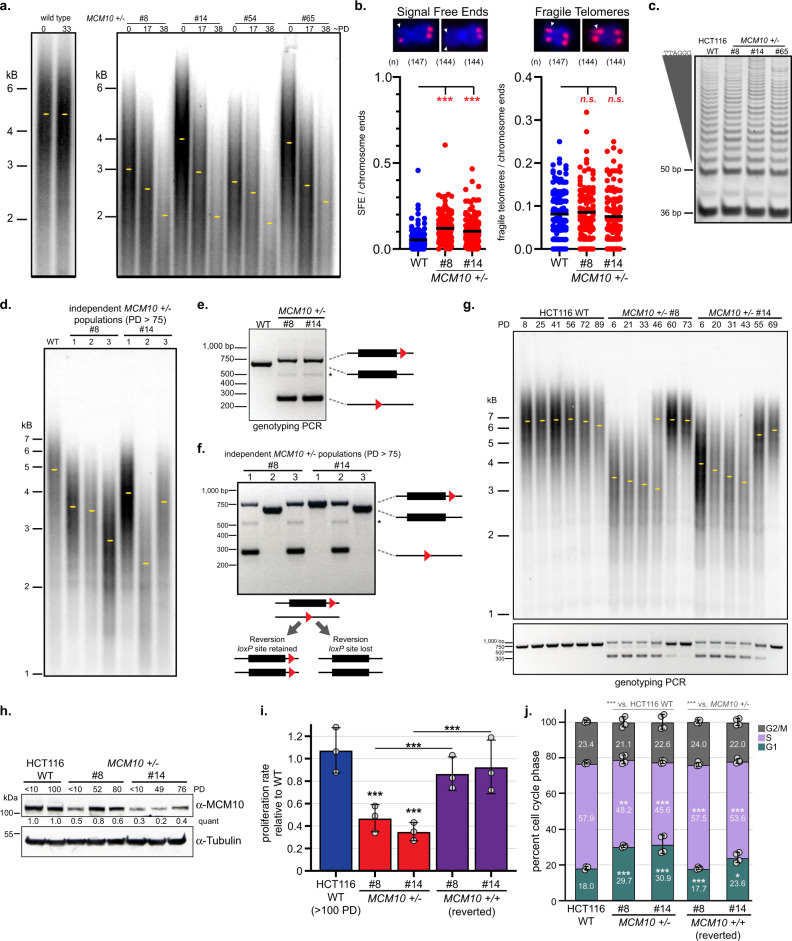
Fig. 3. MCM10 deficiency causes telomere erosion that is rescued following spontaneous reversion of the MCM10 mutant locus.
a TRF analysis of HCT116 wild type and MCM10+/- cells. Estimated PDs and location of peak intensity (yellow ovals) are indicated. b Signal free-ends and fragile telomeres in wild type (blue) and MCM10+/- cells (red). Significance was calculated using an unpaired, two-tailed student’s t-test with ***<.001; n = metaphases analyzed. Scale bars are 1 µm. c TRAP assay from wild type and MCM10+/- cells. The internal PCR control at 36 bp and telomerase products above 50 bp are noted. d TRF analysis of wild type and independent late passage MCM10+/- cell populations (PD > 75). The location of peak intensity (yellow ovals) is indicated. e Genotyping of wild type (middle) or mutant alleles carrying a loxP site 3′ of exon 14 (upper) or a loxP scar (lower). A faint non-specific band is noted (asterisk). f Genotyping in populations analyzed in Fig. 3d showing alleles with one 3′ loxP site (upper) or a loxP scar (lower), and reverted alleles that retained or lost the 3′ loxP site. A faint non-specific band is noted (asterisk). g TRF analysis (top) and genotyping (bottom) in wild type and MCM10+/- cells. PDs and location of peak intensity (yellow ovals) are indicated. h Western blot for MCM10 with quantification normalized to tubulin, relative to the first lane is indicated. PDs for each cell line are noted. i Average proliferation rate in wild type, MCM10+/- and reverted cells normalized to early passage wild type cells, n = 6. Individual data points are indicated (gray circles). j Average cell cycle distribution of wild type, MCM10+/- and reverted cell lines, n = 4. Individual data points are indicated (gray circles). Percentage of each population in G1- (green), S- (purple), and G2/M-phase (gray) is indicated. Error bars in h and i indicate SD and significance was calculated using an unpaired, two-tailed student’s t-test with *<0.05; **<0.01, ***<0.001. Source data for panels a, b, c, d, e, f, g, h, i, and j, including relevant exact p-values, are provided in the Source Data file.

