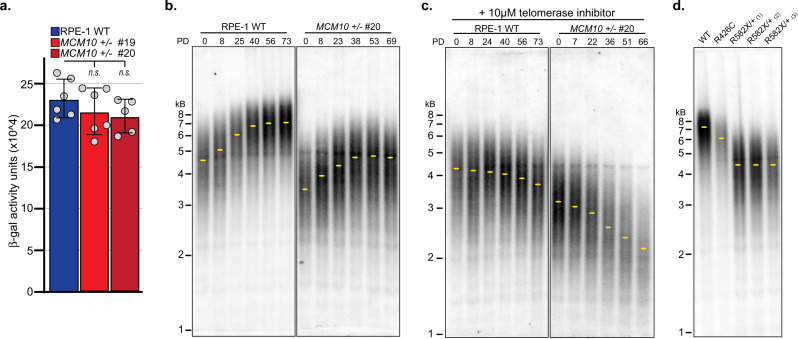
Fig. 5. MCM10 heterozygous RPE-1 cell lines have telomere maintenance defects.
a Average β-gal activity in wild type (blue) and clonal MCM10+/- cell lines (red). For each cell line n = 6 replicates. Individual data points are indicated (gray circles). Error bars indicate SD and significance was calculated using an unpaired, two-tailed student’s t-test with *<0.05; **<0.01, ***<0.001. b TRF analysis in wild type and MCM10+/- clone #20 cell lines. PDs and location of peak intensity (yellow dots) are indicated. c TRF analysis in wild type and MCM10+/- clone #20 cell lines in the presence of telomerase inhibitor. PDs and location of peak intensity (yellow dots) are indicated. d TRF analysis in wild type and MCM10 mutant cell lines carrying NK-associated patient variants. Yellow dots indicate the location of peak intensity. Source data for panels a–d, including relevant exact p-values, are provided in the Source Data file.

