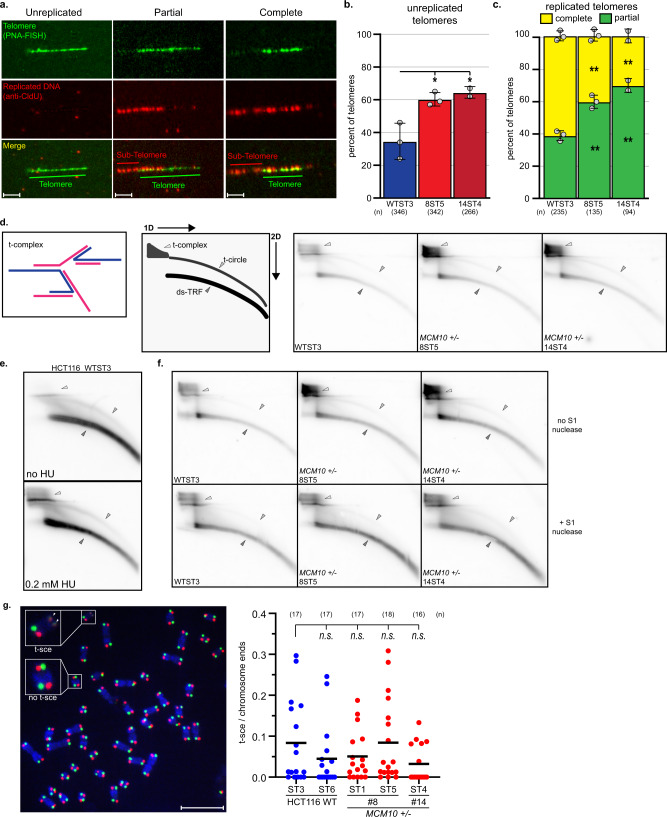
Fig. 7. Telomeric replication stress is increased in ST MCM10+/- HCT116 cells.
a Telomere combing images with telomeric DNA (green), nascent DNA (red), and merged images with examples of unreplicated telomeres (left), partially replicated (middle), and completely replicated telomeres (right). Telomeric and sub-telomeric regions are indicated. Scale bars are 3 µm. b Average percentage of unreplicated telomeres in wild type (blue) and MCM10+/- cell lines (red) ST cell lines, n = total number of telomeres quantified. Average values for each replicate are indicated (gray circles). c Average percentage of completely replicated (yellow) versus partially/stalled telomeres (green) in ST cell lines, n = total number of replicated telomeres quantified. Average values for each replicate are indicated (gray circles). Error bars in b and c indicate SD and significance was calculated using an unpaired, two-tailed student’s t-test with *<0.05; **<0.01, ***<0.001. d (Left) Cartoon of t-complex DNA as formerly depicted37. (Middle) Diagram of double-stranded telomere restriction fragment (ds-TRF), telomere circle (t-circle) and telomere complex (t-complex) DNA species from 2D gel electrophoresis. (Right) Comparison of 2D gels from ST cell lines. e Comparison of DNA species from 2D gel electrophoresis in HCT116 wild-type ST cells with and without 4-day HU treatment. f Comparison of DNA species from 2D gels in HCT116 wild type and MCM10+/- ST cell lines with and without S1 nuclease digestion. g (Left) Image of t-SCE staining in ST cell lines. Examples of a t-SCE event and chromosomes without t-SCE are highlighted. (Right) Percentage t-SCE per chromosome ends. Bars represent average percentage t-SCE per chromosome ends; where n = the number of metaphases analyzed. Significance was calculated using an unpaired, two-tailed student’s t-test but were not statistically significant (n.s.). Scale bar is 10 µm. Source data for panels b, c, d, e, f, and g, including relevant exact p-values, are provided in the Source Data file.

