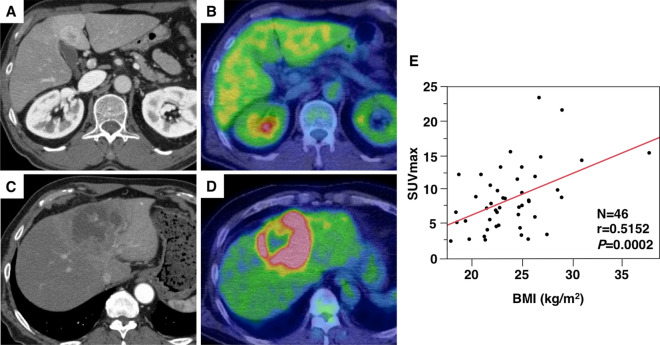
Figure 2.
Representative positron emission tomography/computed tomography (PET/CT) images and the relationship between body mass index (BMI) and the maximum standardized uptake value (SUVmax) (n = 46). A patient with low SUVmax (< 6.79) on preoperative enhanced CT (A) and fluorine-18 fluorodeoxyglucose (18F-FDG) PET/CT (B). A patient with high SUVmax (≥ 6.79) on enhanced CT (C) and 18F-FDG PET/CT (D). The relationship between BMI and SUVmax (E).

