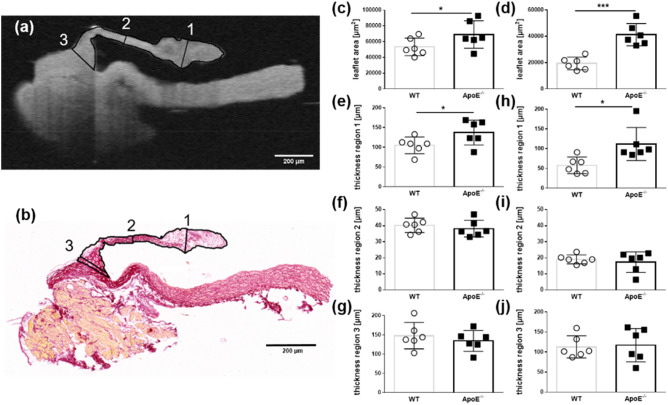
Figure 1.
Quantification of the leaflet area and thickness in WT and ApoE−/− mice (n = 6). (a) OCT scan of a representative acoronary aortic leaflet showing the allocation of the grid pattern to define regions 1, 2, and 3. (b) Histological section of the same representative acoronary aortic valve leaflet and corresponding regions. (c) The mean leaflet area and (e–f) thickness of the acoronary aortic valve leaflets from the OCT scans. (d) The mean leaflet area and (h–j) thickness of the acoronary aortic valve leaflets from histological sections. MW ± SD; *P ≤ 0.05, **P ≤ 0.01, and ***P ≤ 0.001.

