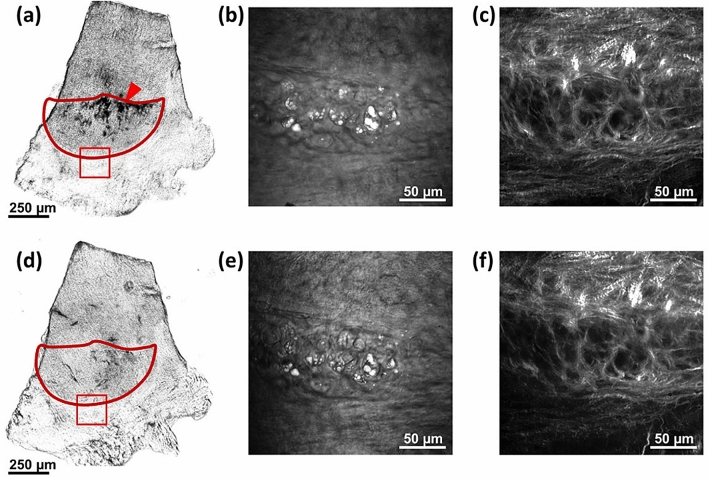
Figure 2.
Images of a leaflet before and after melanin bleaching in 2.5% H2O2 solution. (a) Bright field image of the whole leaflet (red contour) before bleaching showing visible accumulations of melanin (red arrowhead). (b) CARS image of the region of the annulus in the red box in (a) acquired before bleaching with the adipocytes clearly identified by the intense CARS signal of the lipid droplets. (c) SHG image of the region in the red box in (a) acquired before bleaching showing the dense mesh of collagen fibers. (d) Bright field image of the whole leaflet (red contour) after bleaching without any visible melanin. (e) CARS image of the region in the red box in (d) acquired after bleaching with the adipocytes clearly identified by the intense CARS signal of the lipid droplets. (f) SHG image of the region in the red box in (d) showing no alterations of the mesh of collagen fibers after bleaching.

