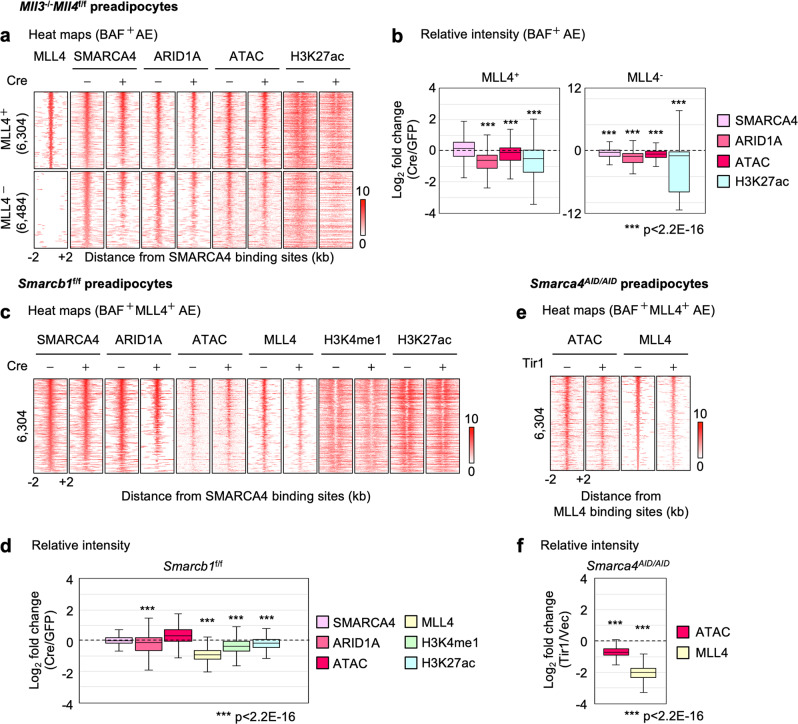
Fig. 6. BAF and MLL4 reciprocally promote each other’s binding to maintain active enhancers in preadipocytes.
Mll3‒/‒Mll4f/f or Smarcb1f/f brown preadipocytes were infected with adenoviruses expressing GFP or Cre. Sub-confluent cells were collected for ChIP-Seq and ATAC-Seq. BAF+ active enhancers (AEs) were defined as those bound by SMARCA4 and ARID1A. a, b Deletion of Mll4 reduces BAF binding on BAF+ AEs in preadipocytes. a AEs shown in the heat maps were ranked by the intensity of SMARCA4 at the center in control (GFP) cells. b Fold changes of intensities between control and Mll4 KO (Cre) cells on MLL4+ (n = 6304) and MLL4- (n = 6484) AEs in preadipocytes are shown in box plots. Statistical significance levels are as follows (Wilcoxon signed rank test, one-sided): SMARCA4 (p = 1); ARID1A (p = 0); ATAC (p = 5.2E-38); H3K27ac (p = 1.6E-293). Exact p-values cannot be computed for SMARCA4 and ARID1A due to ties in the ranks. c, d SMARCB1 is required for maintaining MLL4 binding on BAF+ MLL4+ AEs in preadipocytes. c AEs shown in the heat maps were ranked by the intensity of SMARCA4 at the center in control cells. d Fold changes of intensities between control (GFP) and Smarcb1 KO (Cre) cells on AEs (n = 6,304) in preadipocytes are shown in box plots. Statistical significance levels are as follows (Wilcoxon signed rank test, one-sided): SMARCA4 (p = 1); ARID1A (p = 4.0E-59); ATAC (p = 1); MLL4 (p = 0); H3K4me1 (p = 0); H3K27ac (p = 1.1E-274). Exact p-values cannot be computed for SMARCA4, MLL4 and H3K4me1 due to ties in the ranks. e, f SMARCA4 is required for maintaining MLL4 binding on BAF+ MLL4+ AEs in preadipocytes. Smarca4AID/AID preadipocytes were infected with retroviruses expressing Tir1 or vector (Vec) only, followed by auxin (0.5 mM) treatment for 4 h. Cells were then collected for ATAC-Seq and ChIP-Seq of MLL4. e AEs shown in the heat maps were ranked by the intensity of MLL4 at the center in control cells. f Fold changes of intensities between SMARCA4-depleted (Tir1) and control (Vec) cells on AEs (n = 6,304) in preadipocytes are shown in box plots. Statistical significance levels are as follows (Wilcoxon signed rank test, one-sided): ATAC (p = 0); MLL4 (p = 0). Exact p-values cannot be computed due to ties in the ranks. In b, d and f, box represents the first and third quartiles with the horizontal line showing the median, and whiskers indicating minimum and maximum in all box plots. Outliers were not included.

