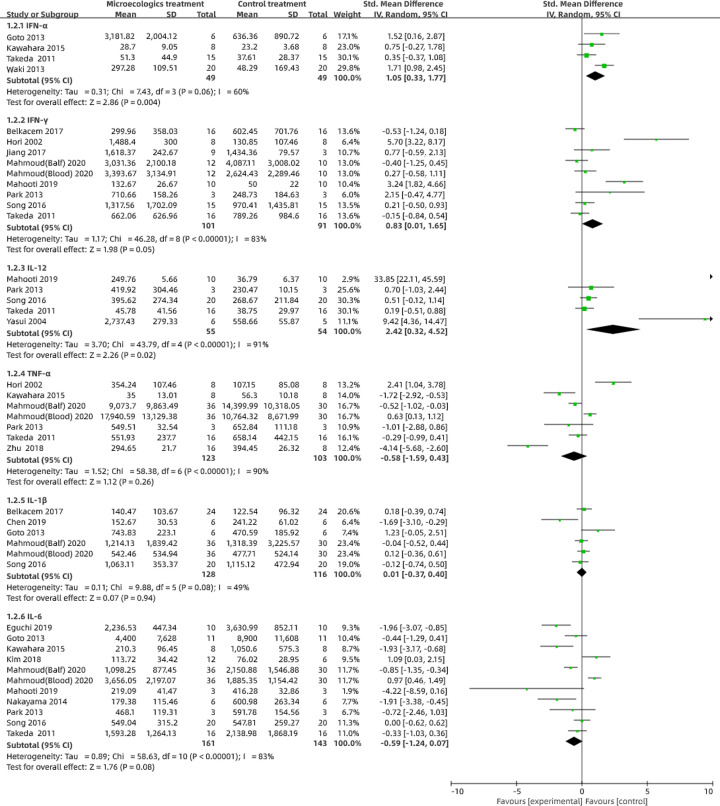
Figure 4. Evaluation of cytokines in preclinical studies.
We evaluated the IFN-α, IFN-γ, IL-12, TNF-α, IL-1β and IL-6 concentrations compared with the control group through a random-effects models using RevMan 5.3. The pooled data are expressed as SD with 95% CIs. I2 and P-values represent the heterogeneity among the studies, while an I2 value >50% and a P-value <0.1 indicate considerable heterogeneity. The 95% CI of the result intersecting with the solid vertical line represents no statistical significance.

