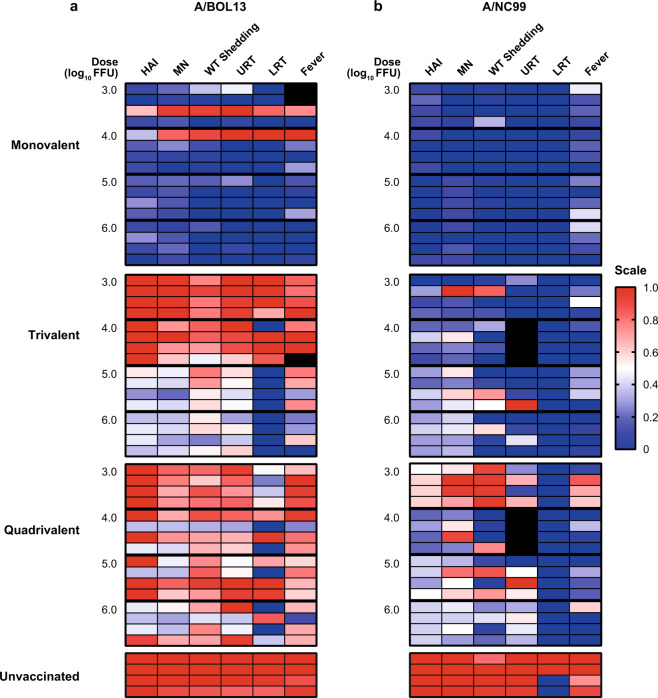
Fig. 6. Summary of endpoints demonstrates reduction in A/BOL13 efficacy in multivalent formulations relative to A/NC99.
Data from multiple endpoints for A/BOL13 a and A/NC99 b vaccine groups were expressed as heatmaps. Each panel shows a single vaccine formulation (top to bottom: monovalent, trivalent, and quadrivalent LAIV, and unvaccinated). Each row represents an individual ferret, with four animals per dose group, with vaccine doses ordered from 3.0 (top) to 6.0 log10 FFU (bottom). Endpoints shown are, left to right: HAI titer; MN titer; geometric mean wt virus shedding (Days 1–3, TCID50); wt virus titer in NT tissue (TCID50); wt virus titer in lung tissue (RT-qPCR); fever (°C). All endpoints, irrespective of units of measurement, were normalized to a uniform 0–1 scale. Immune responses and protection equivalent to the average of the 6.0 log10 FFU monovalent vaccine group were calibrated to 0 (navy blue). Immune responses and protection equivalent to average data from unvaccinated controls were calibrated to 1 (red). White cells indicate mean of red/navy blue. Gray cells indicate missing data points owing to insufficient tissue sample quantity or corrupt telemetry data. A/BOL13 A/Bolivia/559/2013, A/NC99 A/New Caledonia/20/1999, FFU fluorescent focus units, HAI hemagglutination inhibition, LRT lower respiratory tract, MN microneutralization, NT nasal turbinate, QLAIV quadrivalent LAIV, RT-qPCR quantitative reverse transcription-polymerase chain reaction, TCID50 tissue culture infectious dose 50%, URT upper respiratory tract, wt wild type.

