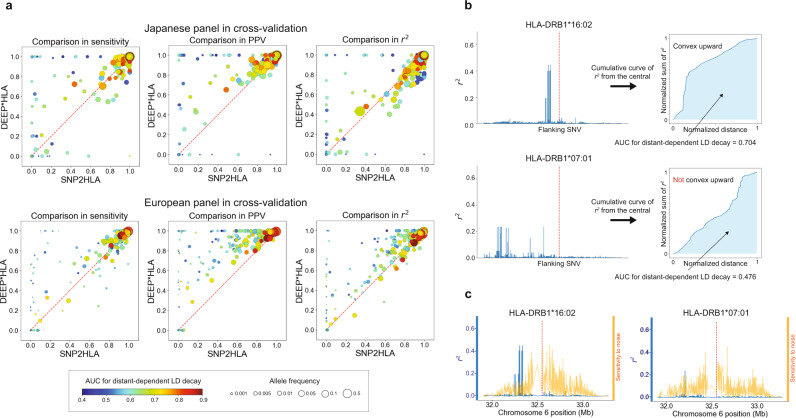
Fig. 4. Comparison between DEEP*HLA and SNP2HLA displayed with allele frequencies and AUC for distance-dependent LD decay.
a Comparisons of imputation accuracy between DEEP*HLA and SNP2HLA for 4-digit allele imputation for cross-validation with the Japanese panel (upper) and T1DGC panels (lower). Each dot corresponds to one allele, displayed with allele frequencies (size) and AUC for distance-dependent LD decay (color). The size and color scales are provided in the bottom of the figure. The AUC was calculated based on bilateral 1000 SNVs. Comparisons in concordance rate are not shown because they were almost the same as those in sensitivity. The performance of SNP2HLA was limited when imputing the alleles with low-frequency and low AUC; DEEP*HLA was relatively accurate even for the less frequent alleles regardless of AUC. b Example illustrations of AUC for distance-dependent LD decay. The left figures illustrate r2 of LD between an HLA allele (red dash line in the central) and flanking SNVs. HLA-DRB1*16:02 has strong LD in close positions and weaker LD in the distant positions. The cumulative curve of r2 of bilateral SNVs becomes convex upward; and the AUC increases. In contrast, HLA-DRB1*07:01 has moderate LD in distant or sparse positions, the curve does not become convex upward, and the AUC becomes smaller. c Comparison between r2 (blue line) and sensitivity maps of DEEP*HLA (orange line) for example alleles (red dash line in the center). The sensitivities are normalized for visibility. In both examples, DEEP*HLA reacted to noise across an extensive area regardless of LD. PPV positive predictive value, AUC area under the curve, LD linkage disequilibrium.

