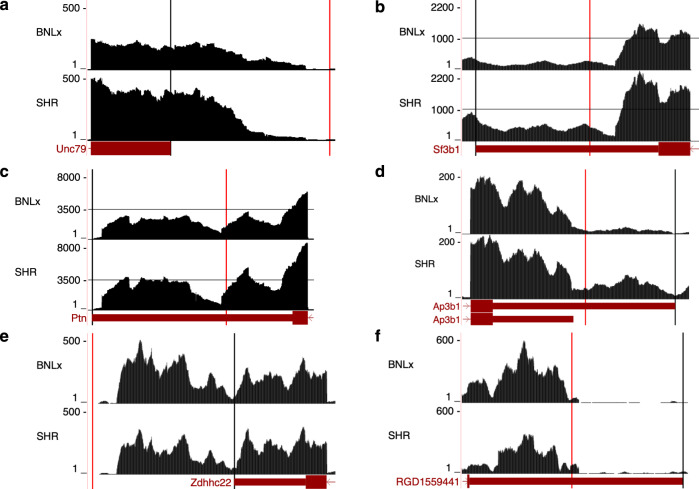
Fig. 6. Incorporation of aptardi into differential expression analyses.
RNA-sequencing (RNA-Seq) read densities for six genes in BNLx and SHR inbred rat strains. Numbers on y axis indicate RNA-Seq read coverage. Read coverage represents the aggregate of three biological samples for each strain. Transcript structures shown are from Ensembl annotation (dark red), where boxes and lines indicate exons and introns, respectively. Black vertical lines denote transcript stop sites identified in the original transcriptome derived using StringTie, and red vertical lines indicate transcript stop sites identified in the aptardi modified transcriptome only. No transcripts were identified as differentially expressed between strains in the original transcriptome (p > 0.001), but at least one differentially expressed transcript for each gene was identified in the aptardi modified transcriptome (p ≤ 0.001). For a Unc79, b Sf3b1, c Ptn, and d Ap3b1 the original transcript isoform (black line) was differentially expressed in the aptardi modified transcriptome, and for e Zdhhc22 and f RGD1559441 the aptardi transcript was differentially expressed (red line). Graphics were generating using the UCSC Genome Browser (https://genome.ucsc.edu/) using the rn6 rat genome assembly.

