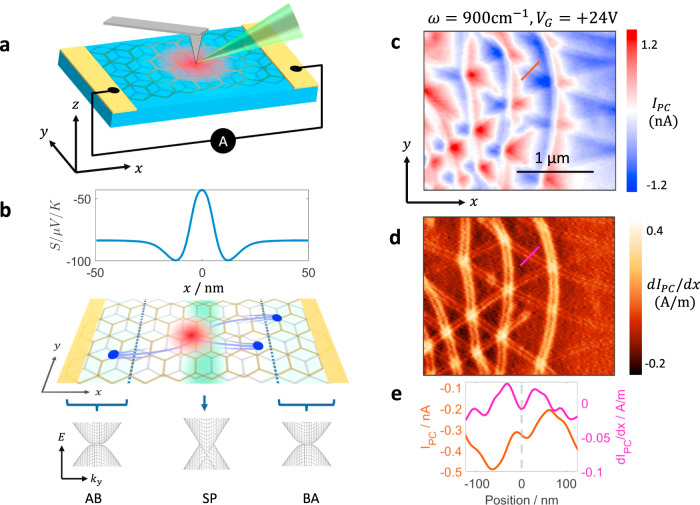
Fig. 1. Photocurrent in minimally twisted bilayer graphene.
a A schematic of scanning photocurrent setup. The red region represents the hot carriers generated under the tip. b Top: Seebeck coefficient S profile across a domain wall calculated from first principles (Supplementary Note 3). The DW is located at x = 0. Middle: perspective view of the experiment showing photocurrent generation at the domain wall. The green background represents the Seebeck coefficient profile and the blue dots represent carriers generated by thermoelectric effect. Bottom: schematic of the BLG band structure across the DW for three different stackings AB, BA, and saddle point (SP). c Photocurrent (IPC) image taken with ω = 900 cm−1 and at . d Spatial gradient of the photocurrent defined as dIPC/dx of the data in c. e Line profiles of IPC and dIPC/dx across a DW (shown as red and magenta lines in c and d).

