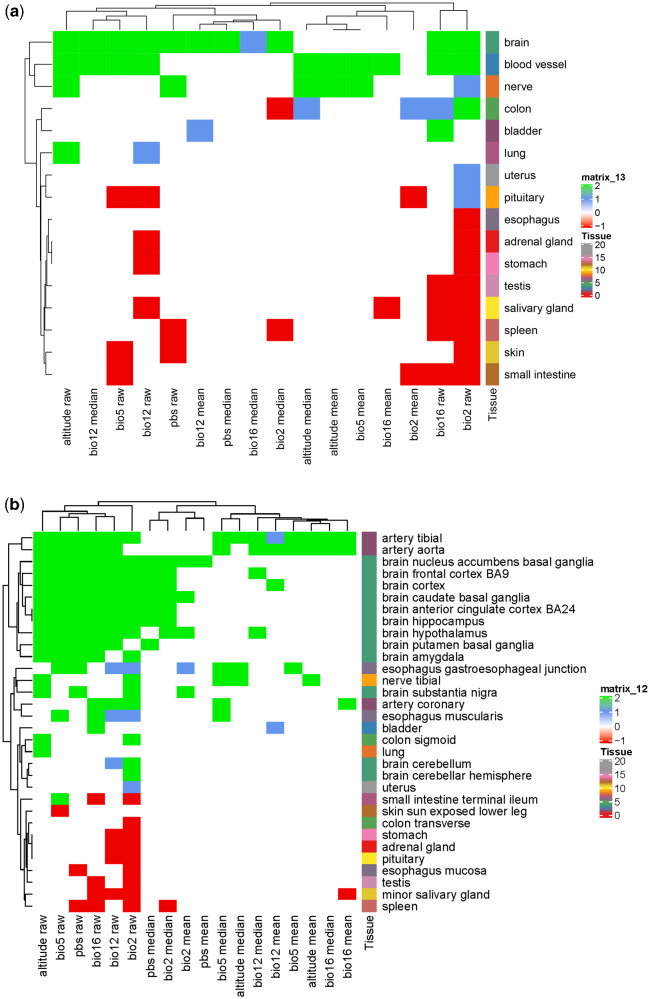
Fig. 7.
Pattern of enrichment of the top 0.001 gene sets identified by PBS and Baypass among genes up or down regulated in (human-based) GTEx tissues. Gene sets can be enriched specifically among genes up or down regulated in a certain tissue or simply showing differential expression in the tissue relative to others, irrespective of direction. Results are colored according to among which of these categories of differentially expressed genes for each tissue the PBS and Baypass gene sets were enriched. Gene sets enriched among genes downregulated (possibly also showing enrichment among the set of undirected differential expression) in a particular tissue are colored red, those enriched among genes upregulated (again, possibly also showing enrichment among the set of undirected differential expression) in the tissue are colored green and those enriched among genes differentially expressed in the tissue only when ignoring direction are colored blue. Blank (white) cells indicate no enrichment. Tissues that did not show any enrichment are not included in the figure. Hierarchical clustering of gene sets and tissues was based on the extent of sharing of significant hits. (a) Comparison of 30 tissues. (b) Comparison of 54 tissues.

