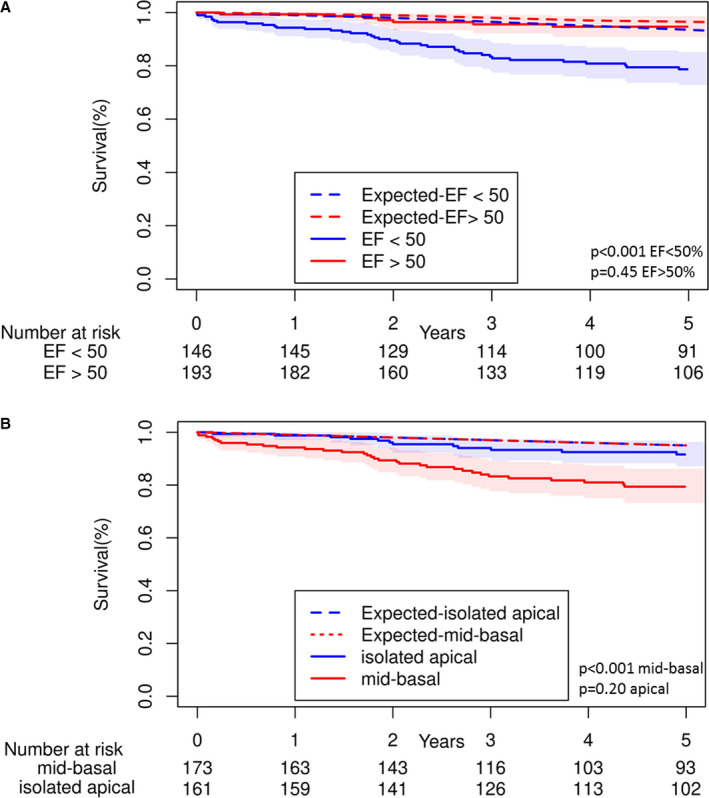
Figure 5. Comparison of overall mortality between left ventricular noncompaction and expected US age‐ and sex‐matched population rates, stratified by left ventricular ejection fraction (A) and noncompaction extent (B).

Shaded regions indicate 95% CIs. EF indicates ejection fraction.
