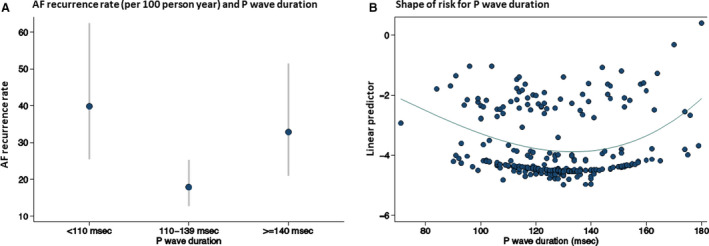
Figure 2. Atrial fibrillation recurrence according to P‐wave duration.

A, Atrial fibrillation recurrence rate per 100 person‐year and P‐wave duration (grouped according to predefined cut‐offs of P wave); dots indicate the rate per 100 person years, whiskers indicate the 95% CIs of the rates. B, Shape of the risk of atrial fibrillation after pulmonary vein ablation in relationship to P‐wave duration. The shape of the risk of recurrence of AF over P‐wave duration is shown, computed using fractional polynomial. For this purpose, the linear predictor (y axis) derived by a Cox model using fractional polynomial is plotted against P‐wave duration (x axis). The best fit for this model includes a power 2 and a power 3 term. There is no physical interpretation of the values on the y axis. AF indicates atrial fibrillation.
