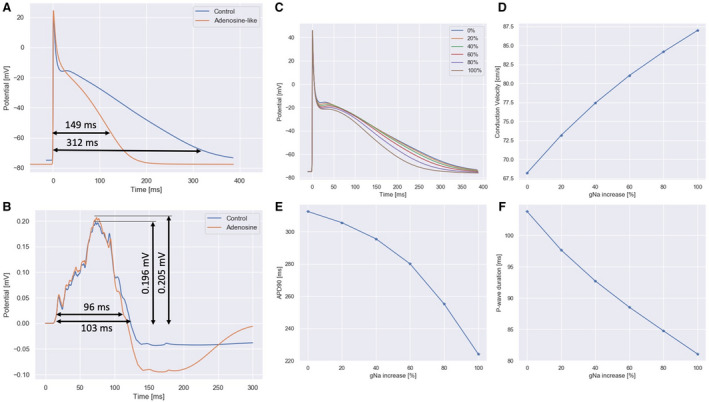
Figure 5. In‐silico simulation of the effect of adenosine.

A, action potential in control and adenosine showed a triangular shape, with action potential duration 90 reducing from 312 ms to 149 ms from control to adenosine case (52% reduction). B, simulated P wave in lead II showed a reduction in duration from 103 ms to 96 ms (7% reduction). C through F, effect of an increase of sodium channels conductance from 0% to 100%. C, resting action potential shape. D, conduction velocity in a 1‐dimensional fiber strand. E, Action potential duration 90. F, P‐wave duration in lead II. A 100% increase in sodium conductance yielded a 26% increase of conduction velocity, a 28% reduction in action potential duration 90 and a 22% reduction in P‐wave duration.
