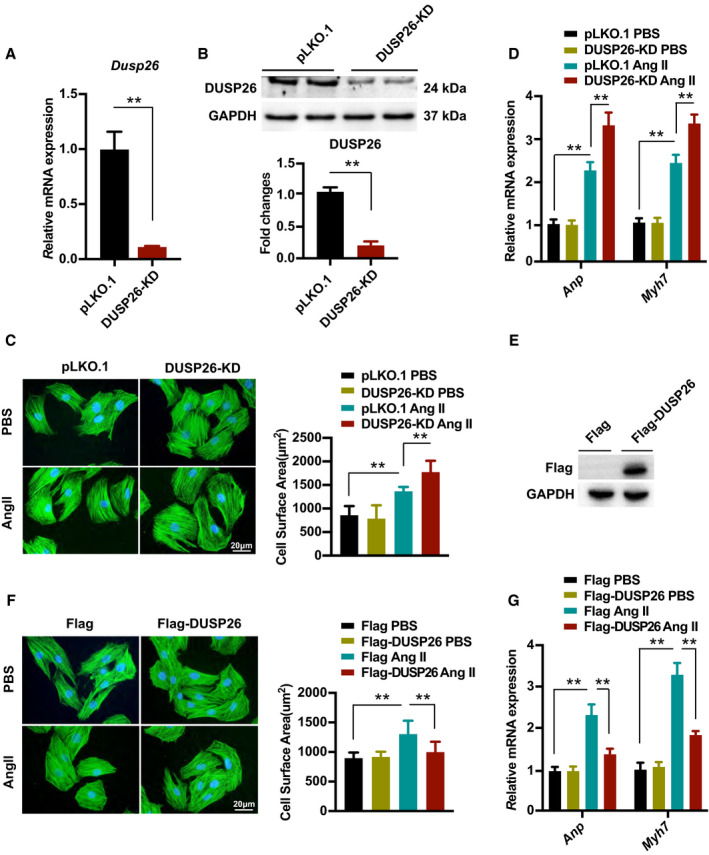
Figure 2. DUSP26 suppressed angiotensin II–induced cardiomyocyte hypertrophy.

A and B, Real‐time PCR analysis (A) and western blot (B) of DUSP26 levels in H9C2 cells infected with lentiviruses targeting DUSP26 or nontargeting pLKO.1 vector. C, Representative images of H9C2 cells infected with lentiviruses targeting DUSP26 or nontargeting pLKO.1 vector and treated with angiotensin II (1 μmol/L) or PBS for 48 hours. Cardiomyocytes were stained with antibody against α‐actinin. Quantitative data of average myocyte surface area. (blue, nucleus; green, α‐actinin; scale bar, 20 μm). D, Real‐time PCR analysis of hypertrophic markers expression in H9C2 cells infected with lentiviruses targeting DUSP26 or nontargeting pLKO.1 vector followed by PBS or angiotensin II (1 μmol/L) treatment for 48 hours. E, Western blot analysis of DUSP26 levels in H9C2 cells infected with lentiviruses containing Flag‐DUSP26 or Flag‐control. F, Representative images of H9C2 cells infected with indicated lentiviral vectors followed by PBS or angiotensin II (1 μmol/L) treatment for 48 hours and quantitative data of average myocyte surface area. (blue, nucleus; green, α‐actinin; scale bar, 20 μm). G, Quantification results for mRNA levels of the hypertrophic marker genes (Anp, Myh7) in H9C2 cells infected with lentiviruses containing Flag‐DUSP26 or Flag‐control followed by PBS or angiotensin II (1 μmol/L) treatment for 48 hours. Data are presented as the mean±SD. **P<0.01. Anp indicates atrial natriuretic peptide; DUSP26, dual‐specificity phosphatase 26; Myh7, myosin heavy chain 7; PBS, phosphate‐buffered saline; and PCR, polymerase chain reaction.
