
Figure 6. Right ventricle (RV) hypertrophy is characterized by larger mitochondria while RV failure is characterized by smaller mitochondria.
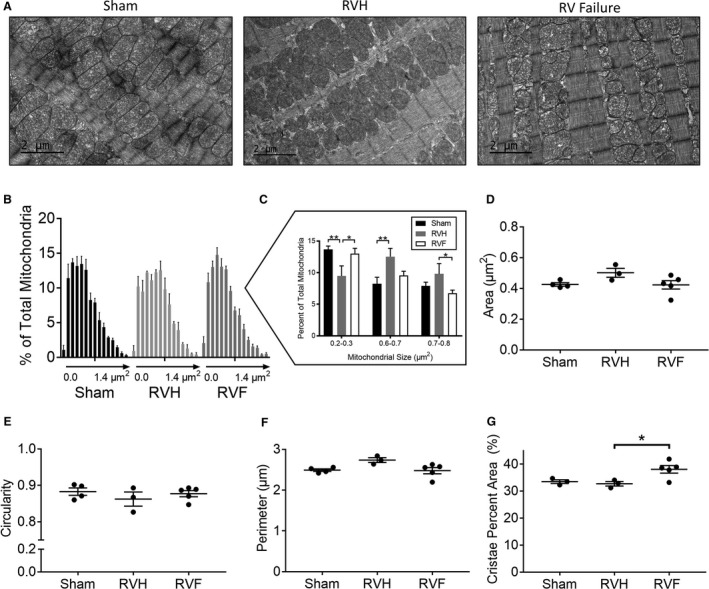
A, Representative electron microscopy images from sham, RV hypertrophy, and RV failure. (B) Histogram of mean mitochondrial area in each group. Each data point represents increments in mitochondrial area of 0.1 μm2 from left to right. (C) Mitochondrial area distribution compared between each group demonstrates a greater percent of larger mitochondria in RV hypertrophy compared with RV failure. There was no change in the overall median mitochondrial (D) area, (E) circularity, (F) perimeter, and (G) mitochondrial cristae density between Sham, RV hypertrophy, and RV failure. n=3 to 6/group, 250 mitochondria assessed/group. Scale bars are 2 μm. Data are presented as mean±SEM and analyzed using one‐way ANOVA. RVF indicates right ventricular failure; and RVH, right ventricular hypertrophy. *P<0.05, **P<0.01.