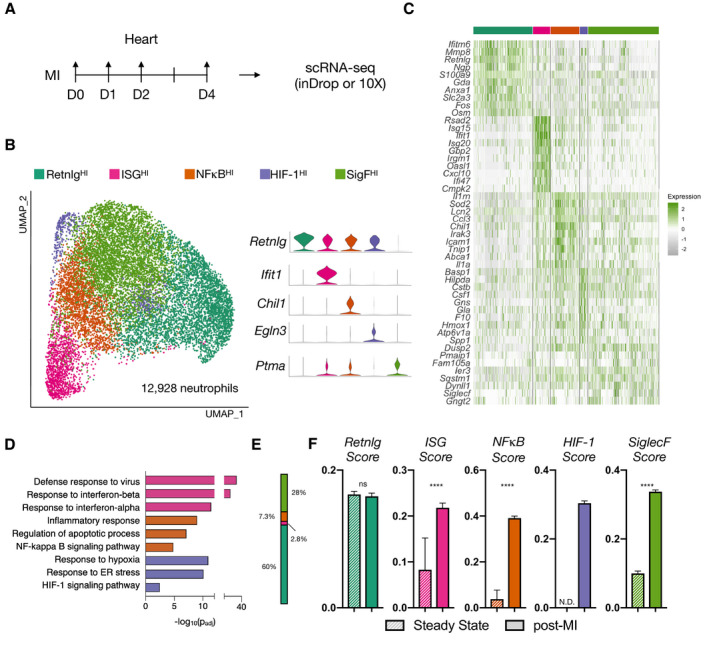
Figure 1. Single‐cell RNA sequencing reveals distinct MI‐induced cardiac neutrophil heterogeneity.

A, Experimental design. B, UMAP of pre‐ and postinfarct (D1, D2, D4; n=4) integrated neutrophils (12 928 neutrophils), color‐coded by cluster with marker genes shown in violin plots. C, Heatmap displaying top 10 DEGs. D, Cluster‐specific gene set enrichment analysis (Gprofiler). E, Fractional membership of pre‐infarct neutrophils. F, Subset‐specific scores applied to pre‐ and postinfarct data. Data shown are mean±SEM of single‐cell values (****P<0.0001; Mann–Whitney test). ER indicates endoplasmic reticulum; DEGs, differentially expressed genes; HIF, hypoxia‐inducible factor; MI, myocardial infarction; and UMAP, uniform manifold approximation and projection.
