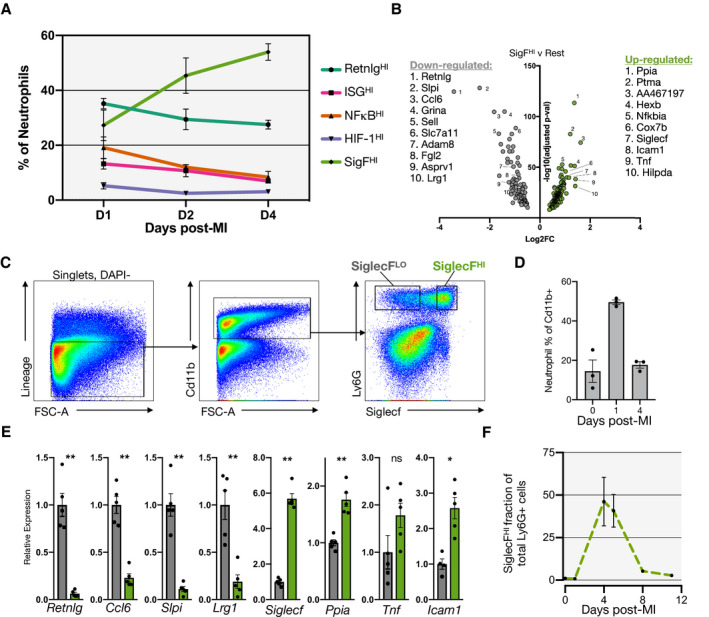
Figure 2. Siglecf expression marks a late‐stage cardiac granulocyte.

A, Fractional membership of scRNA‐seq neutrophil subsets across time after MI. B, Volcano plot of DEGs of SigFHI vs rest of clusters (Wilcoxon rank test). C, Flow cytometry of leukocytes isolated on D4‐post MI and immunostained for Cd11b, Ly6G, and SiglecF. D, Neutrophil quantification as a fraction of total Cd11b+ cells in the heart at steady state and on D1 and D4 post‐MI. E, qPCR results comparing SiglecFLO (gray) and SiglecFHI (green) granulocytes (n=5). F, Fractional membership of SiglecFHI neutrophils as function of time post‐MI (n=3). Data shown are mean±SEM. (**P<0.01, *P<0.05; Student t test). DEGs indicates differentially expressed genes; MI, myocardial infarction; qPCR, quantitative polymerase chain reaction; and scRNA‐seq, single‐cell RNA‐sequencing.
