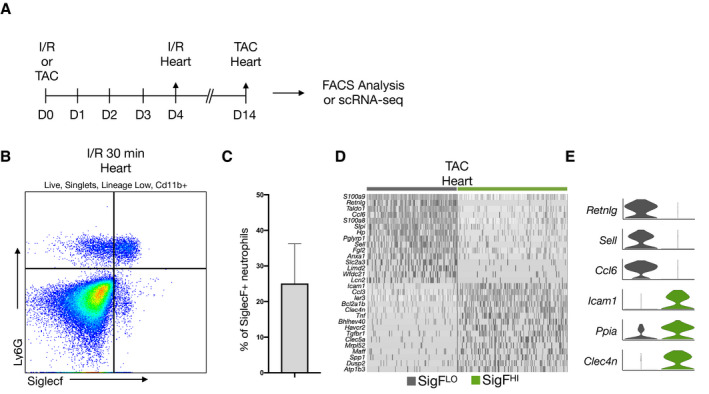
Figure 4. SigFHI neutrophils emerge in ischemia–reperfusion and TAC‐induced pressure overload models.

A, Workflow for I/R flow cytometry (n=3) and TAC scRNA‐seq (n=2) experiments. B, Flow cytometry data of leukocytes isolated from the heart on Day 4 post‐I/R and stained for DAPI, Cd11b, Ly6g, and SiglecF. C, Enumeration of SiglecFHI neutrophils as a percentage of total Cd11b+Ly6G+ neutrophils. D, Heatmap of SiglecFLO and SiglecFHI neutrophils, isolated from the heart 14 days after TAC surgery. Top DEGs of each subset are displayed. E, Violin plots displaying expression of top markers for each subset from D. DAPI indicates 4′6‐diamidino‐2‐phenylindole; DEGs, differentially expressed genes; I/R, ischemia–reperfusion; scRNA‐seq, single‐cell RNA‐sequencing; and TAC, transaortic constriction.
