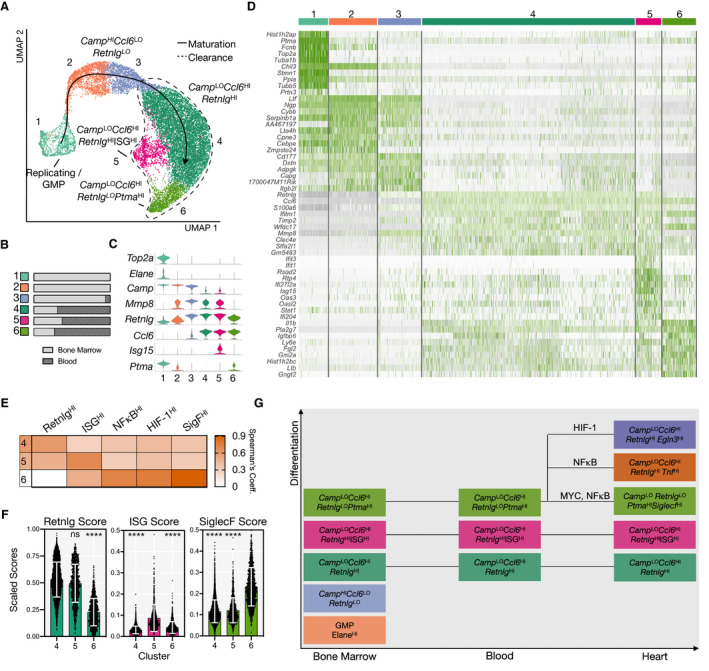
Figure 6. RetnlgHI, ISGHI, and SigFHI neutrophils have correlates in BM and blood.

A, UMAP of integrated neutrophils and neutrophil progenitors isolated from BM and peripheral blood of mice with (D1, D2, D4) and without MI. Clusters ordered along maturation axis as indicated by solid line arrow. Dashed area shows clusters found in blood. B, Fractional representation of tissue by cluster. C, Violin plot showing marker genes for each cluster. D, Heatmap showing top 10 DEGs per cluster. E, Spearman's rank coefficients showing similarity of clusters 4, 5, and 6 to cardiac subsets. F, Retnlg, ISG, and SiglecF scores, as defined previously, applied to clusters 4, 5, and 6. G, Diagram showing evolution of neutrophil differentiation across tissue compartments. BM indicates bone marrow; DEGs, differentially expressed genes; and UMAP, uniform manifold approximation and projection.
