
Figure 5. Adjusted* mean age (95% CI) of diagnosis of hypertension among US adults for overall and by sex: trends from 2008 to 2017.
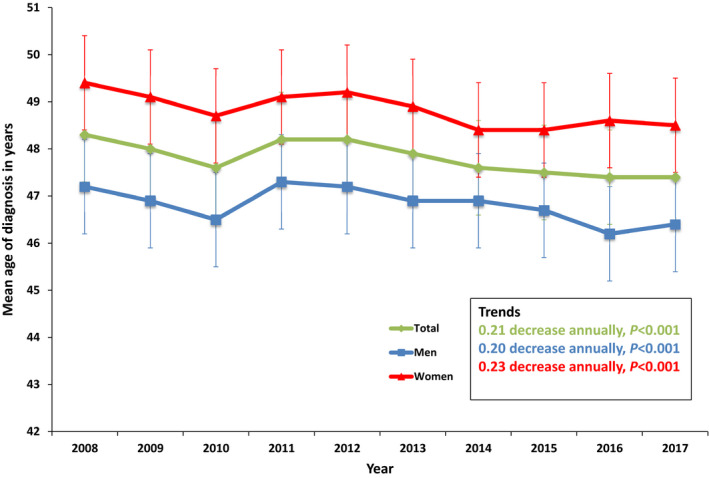
*Adjusted for current age group, race/ethnicity, level of income, type of health insurance, and Charlson comorbidity index.