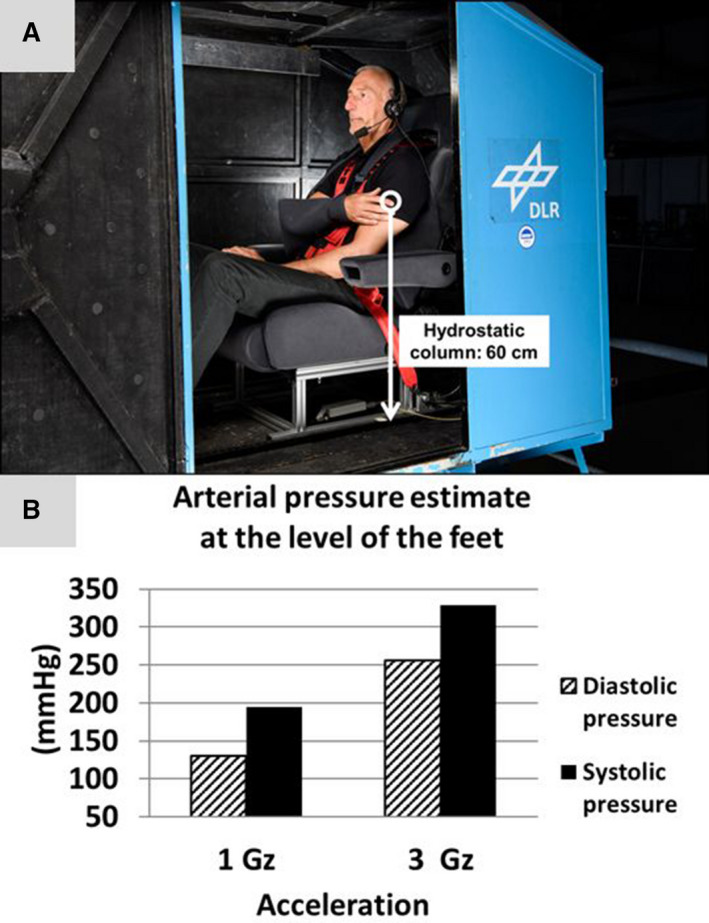
Figure 1. Evolution of the estimated arterial pressure at the level of the feet during centrifugation.

A, A representative participant sitting inside the centrifuge gondola with the right arm fixated at the level of the heart for beat‐to‐beat blood pressure measurements. The white arrow indicates the hydrostatic column of interest for arterial pressure estimates at the level of the feet. B, Graphs indicate averaged diastolic (shaded columns) and systolic (black columns) pressure at the level of the feet in 18 participants.
