
Figure 2. Effects of 15 minutes of 3 Gz hypergravity on the cardiovascular system, red blood cell function, and cell‐based blood coagulation.
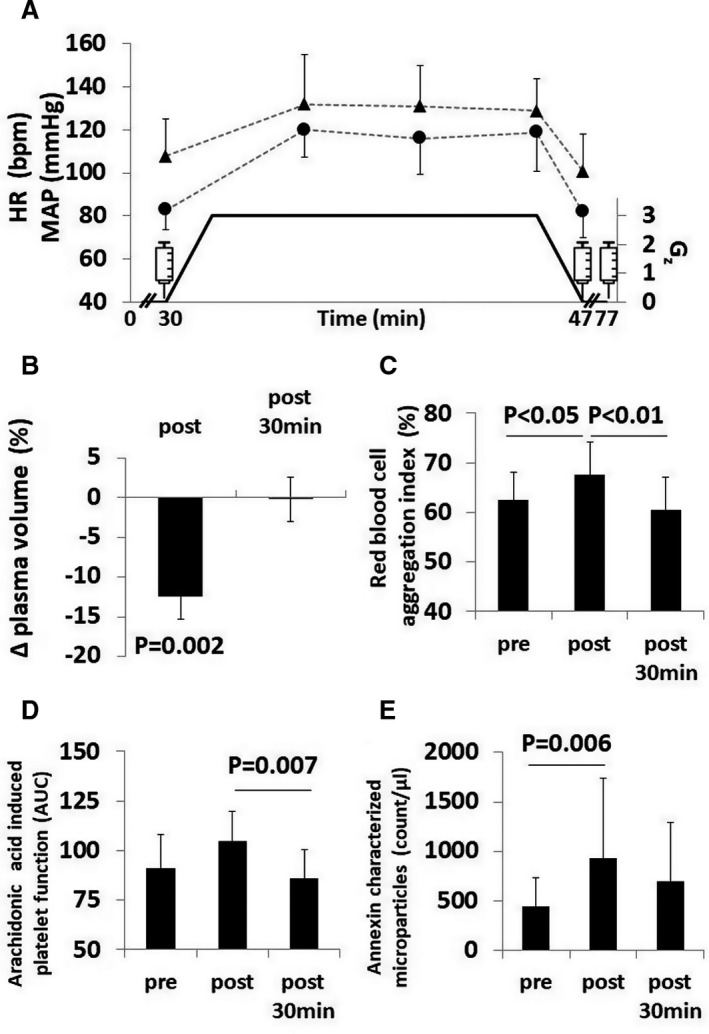
A, Black triangles are medians±interquartile range and black dots are means±SD indicating heart rate (HR) and mean arterial pressure (MAP) responses with respect to gravity load shown by black graph. One‐minute intervals were averaged at pre and post and 5‐minute intervals were averaged during centrifugation. Syringes indicate blood draws (pre, post, post+30); (B) black columns indicate medians of relative plasma changes±interquartile range at post and post+30 compared to pre; (C) black columns show mean±SD aggregation index of red blood cells before, after and 30 minutes after hypergravity exposure; (D) black columns give median±interquartile range of the area under the curve (AUC) of platelet activation with arachidonic acid before, after, and 30 minutes after hypergravity; (E) black columns give median±interquartile range of the counts of microparticles presenting externalized phosphatidylserine characterized by annexin surface markers before, after, and 30 minutes after hypergravity.