
Figure 6. Immunohistochemistry staining for Ki‐67 and TUNEL.
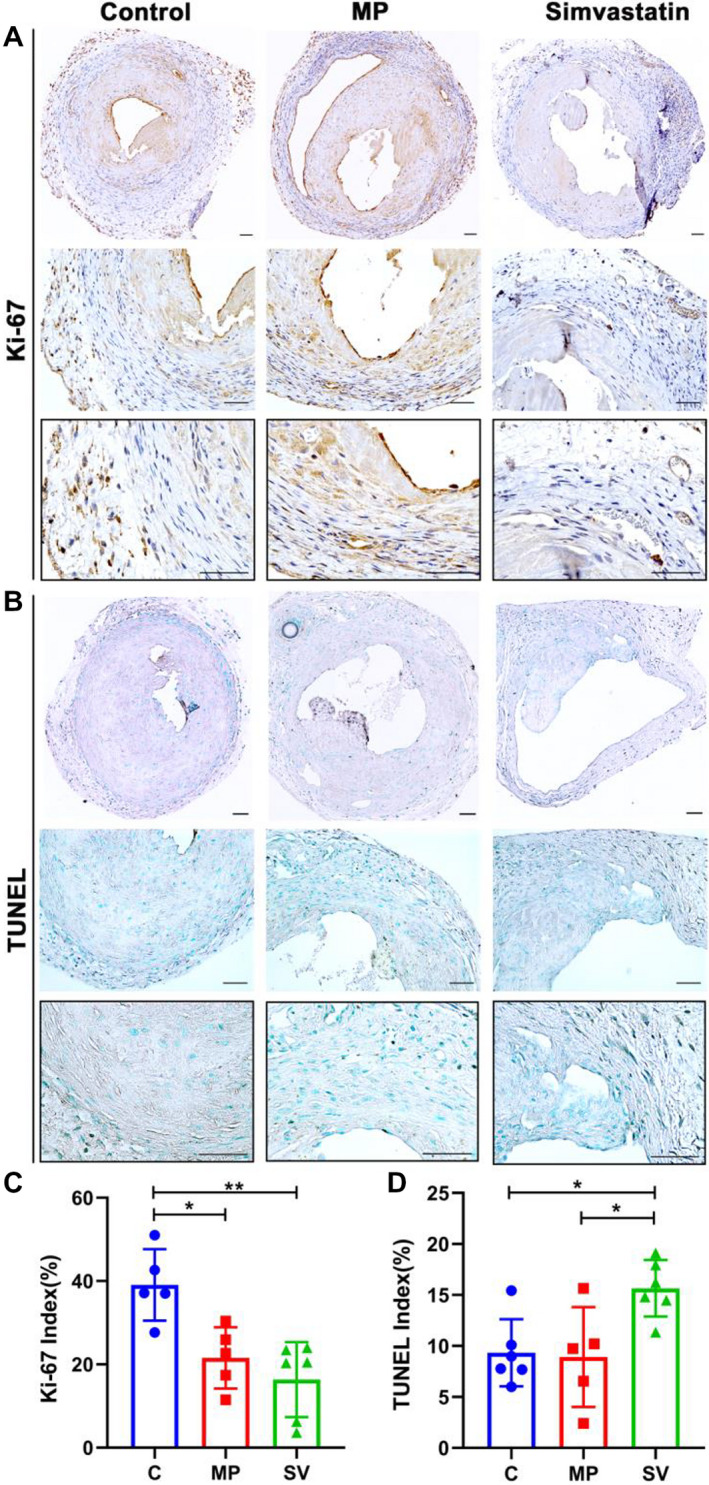
A, Representative staining for Ki‐67 at day 28. Cells staining brown are positive for Ki‐67. B, Representative staining for TUNEL. Cells staining black are positive for TUNEL. C, Semiquantitative analysis showed a significant decrease in the average Ki‐67 positive index in the SV‐treated vessels compared with control and MP groups (C N=5, MP N=5, SV N=6). D, Semiquantitative analysis showed a significant increase in the average TUNEL positive staining in SV‐treated vessels compared with control group and MP group (Control N=6, MP N=5, Simvastatin N=6). Two‐sample t test was performed (C and D). Each bar represents mean±SD. Significant differences are indicated by *P<0.05 and **P<0.01. Scale bar is 50 μm. C indicates controls; dUTP, deoxyuridine triphosphate; MP, microparticles; SV, simvastatin; and TUNEL, terminal deoxynucleotidal transferase–mediated biotin–deoxyuridine triphosphate nick‐end labeling.