
Figure 8. Immunohistochemistry staining for MCP‐1 and CD68.
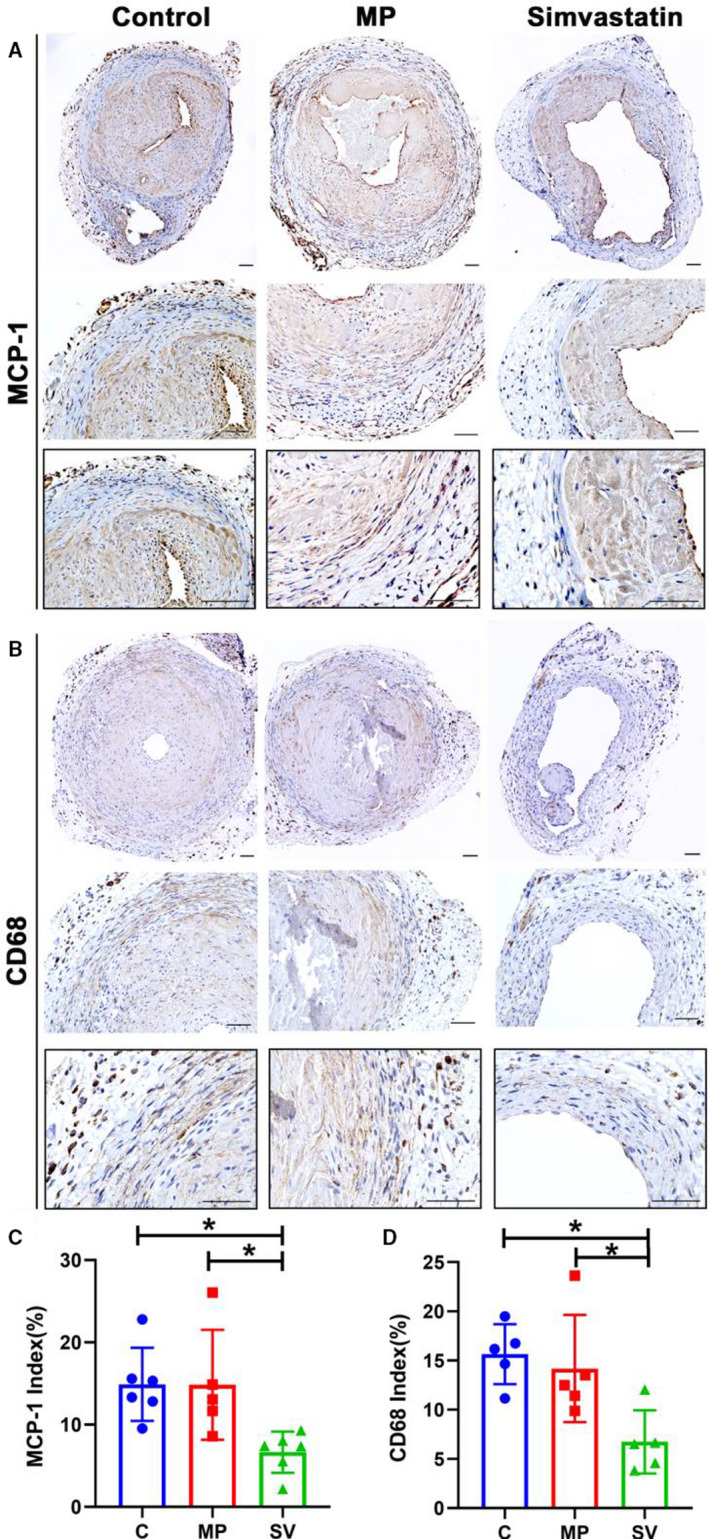
There is decreased inflammation in SV‐treated vessels compared with control and MP group as assessed by MCP‐1 and CD68 staining. A and B, Representative sections of MCP‐1 (A) and CD68 (B) staining at day 28. C and D, Semiquantitative analysis showed a significant decrease in the MCP‐1 (C N=6, MP N=5, SV N=5) and the CD68‐positive (C N=5, MP N=5, SV N=5) index in the SV‐treated vessels compared with the control and MP group. Cells staining brown are positive for MCP‐1 and CD68. Two‐sample t test was performed (C and D). Each bar represents mean±SD. Significant differences are indicated by *P<0.05. Scale bar is 50 μm. C indicates controls; CD68, cluster of differentiation 68; MCP‐1, monocyte chemoattractant protein‐1; MP, microparticles; and SV, simvastatin.