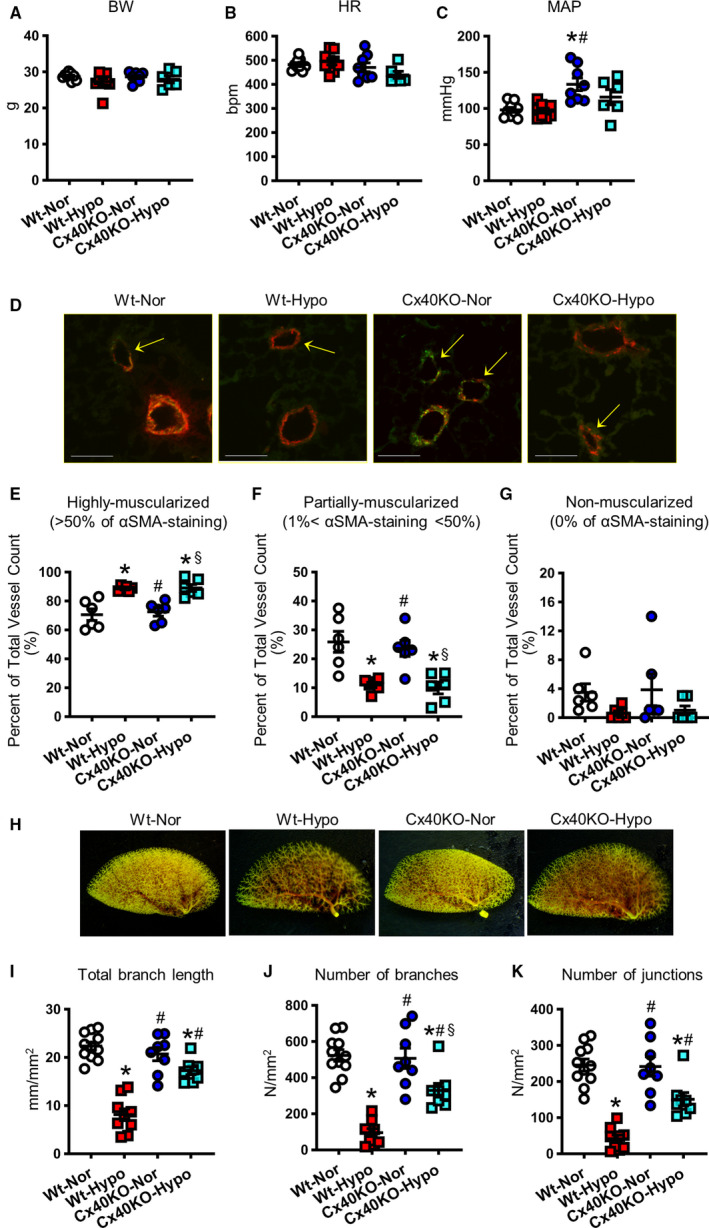
Figure 5. Characterization of wild‐type (Wt) and connexin 40 knockout (Cx40KO) mice with or without 4 weeks of hypoxic exposure.

A–C, Hemodynamic parameters. A, Body weight (BW). B, Heart rate (HR). C, Mean arterial pressure (MAP). Wt mice exposed to normoxia (Wt‐Nor), nmice=9; Wt mice exposed to hypoxia (Wt‐Hypo), nmice=9; Cx40KO mice exposed to normoxia (Cx40KO‐Nor), nmice=8; Cx40KO mice exposed to hypoxia (Cx40KO‐Hypo), nmice=6. D‐G, Muscularization of the pulmonary arterioles. D, Representative images. Pulmonary arteries were stained with von Willebrand factor AF488 (an endothelial cell marker) and anti–α‐smooth muscle actin–Cy3 (αSMA; a smooth muscle cell marker). Bar=70 µm. Peripheral pulmonary arteries (20 µm<diameter<70 µm) were classified into highly muscularized (>50% of αSMA staining; E), partially muscularized (1%<αSMA staining<50%; F), and nonmuscularized (0% of αSMA staining; G). Nmice=6 per group. H‐K, Lung angiograph. H, Representative images. I, Total branch length. J, Number of branches. K, Number of junctions. Wt‐Nor, nmice=11; Wt‐Hypo, nmice=9; Cx40KO‐Nor, nmice=8; Cx40KO‐Hypo, nmice=8. Data are mean±SEM. *P<0.05 vs Wt‐Nor. # P<0.05 vs Wt‐Hypo. § P<0.05 vs Cx40KO‐Nor. Statistical comparison between 4 groups was made by 1‐way ANOVA with Bonferroni post hoc test. In the data of Figure 5A, 5G, and 5K, Kruskal‐Wallis test was used for the statistical comparison.
