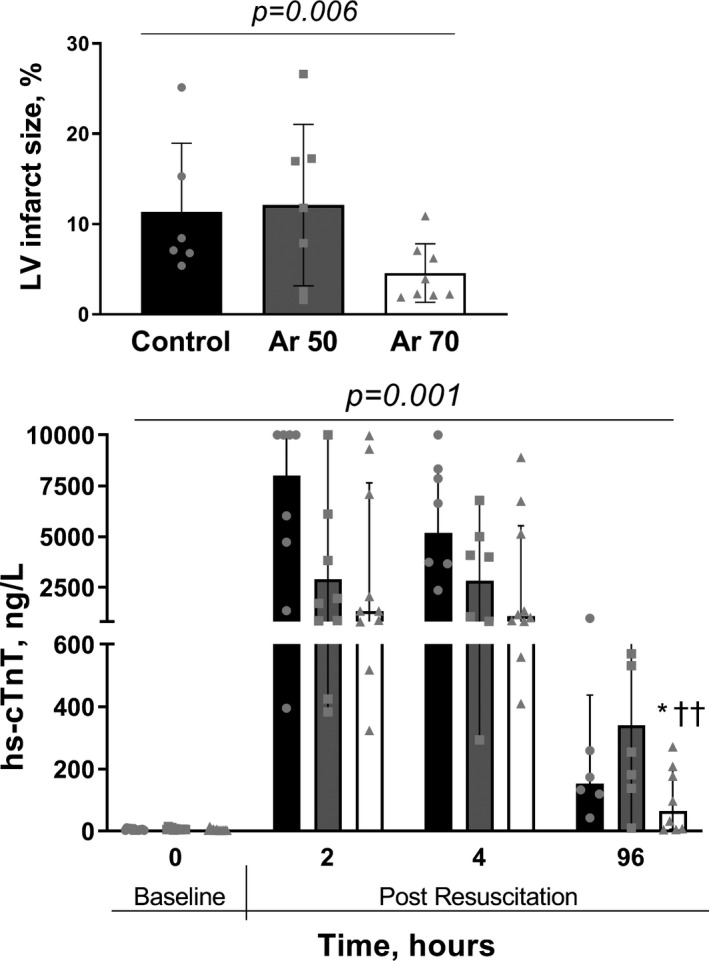
Figure 9. Top, Left ventricular infarct size, as the percentage of triphenyltetrazolium chloride–negative area relative to the left ventricular area in animals treated with argon (Ar) in comparison to controls (Kruskal‐Wallis test). Bottom, Plasma high‐sensitivity cardiac troponin T in Ar‐treated animals and controls, at baseline, during the 4‐hour post‐resuscitation period and 96 hours later.

Two‐way ANOVA (P for treatment at the top) with Tukey multiple comparisons test on log‐transformed concentrations. Median and interquartile range plus jittered dots for single animals. *P<0.05 vs control; †† P<0.01 vs Ar 50%.
