
Figure 1. Median percent change in cholesterol efflux capacity (CEC) in anacetrapib vs placebo.
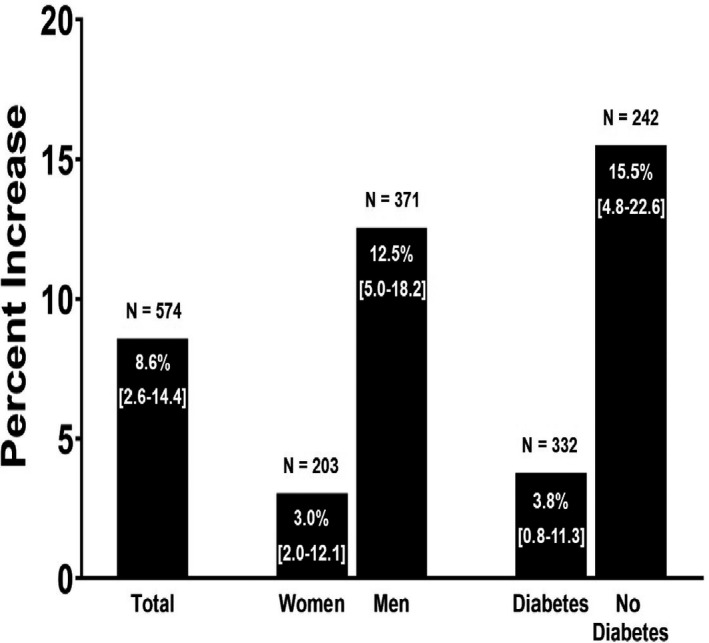
The percent change was calculated separately in the anacetrapib and placebo groups by taking the difference between the week 24 and week 0 unadjusted values for CEC and lipids and dividing by week 0. The median percent increase was the median difference between the anacetrapib group and the placebo group. 95% CIs for median percent change are shown on each bar in brackets. P<0.0001 for women vs men and diabetes mellitus (DM) vs no DM.