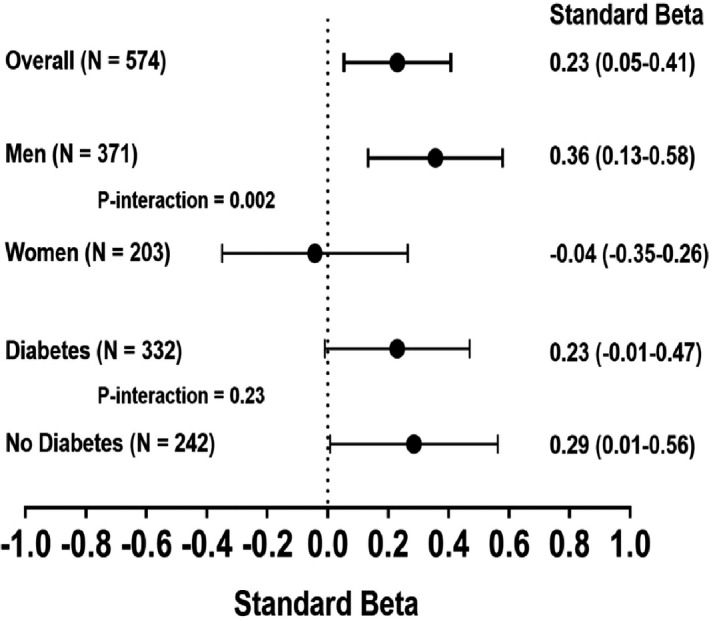
Figure 2. Association between anacetrapib and change in cholesterol efflux capacity (CEC).

The standardized β estimate represents the SD change in efflux in the anacetrapib group vs placebo presented as standard β (95% CI). Estimates derived from multivariable linear regression models including baseline CEC, covariates of sex, ethnicity, diabetes mellitus (DM) status, and type of statin, along with baseline and change in high‐density lipoprotein cholesterol, apolipoprotein A‐I, apolipoprotein B, and triglycerides. A separate model was constructed for each group (ie, overall, men). P interaction terms were calculated to determine the presence of effect modification by sex and DM status (P interaction for the product of sex×anacetrapib [0.002], presence of DM×anacetrapib [0.23]).
