
Figure 3. Association between anacetrapib and cholesterol efflux capacity (CEC) based on haptoglobin genotype.
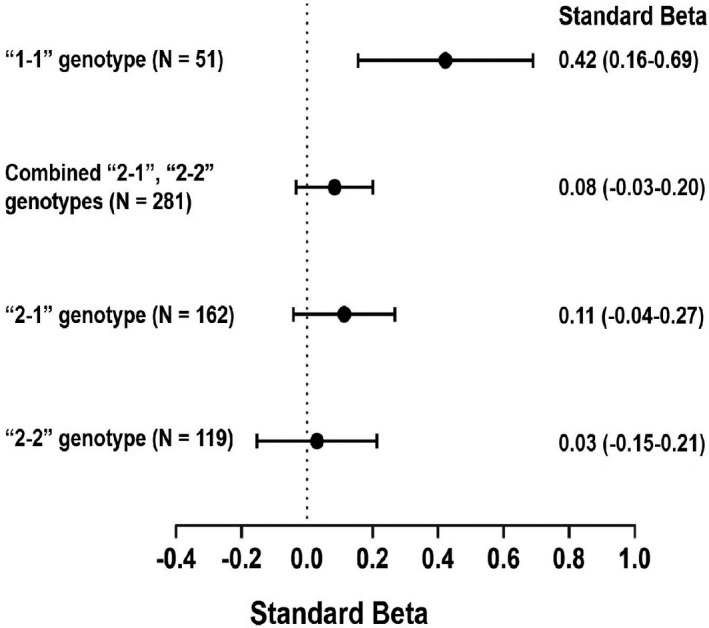
The standardized β estimate represents the SD change in efflux in the anacetrapib group vs placebo presented as standard β (95% CI). Estimates derived from multivariable linear regression models including baseline CEC. “1‐1” indicates haptoglobin “1‐1” genotype; “2‐1”: haptoglobin “2‐1” genotype; and “2‐2”: haptoglobin “2‐2” genotype.