Figure 4.

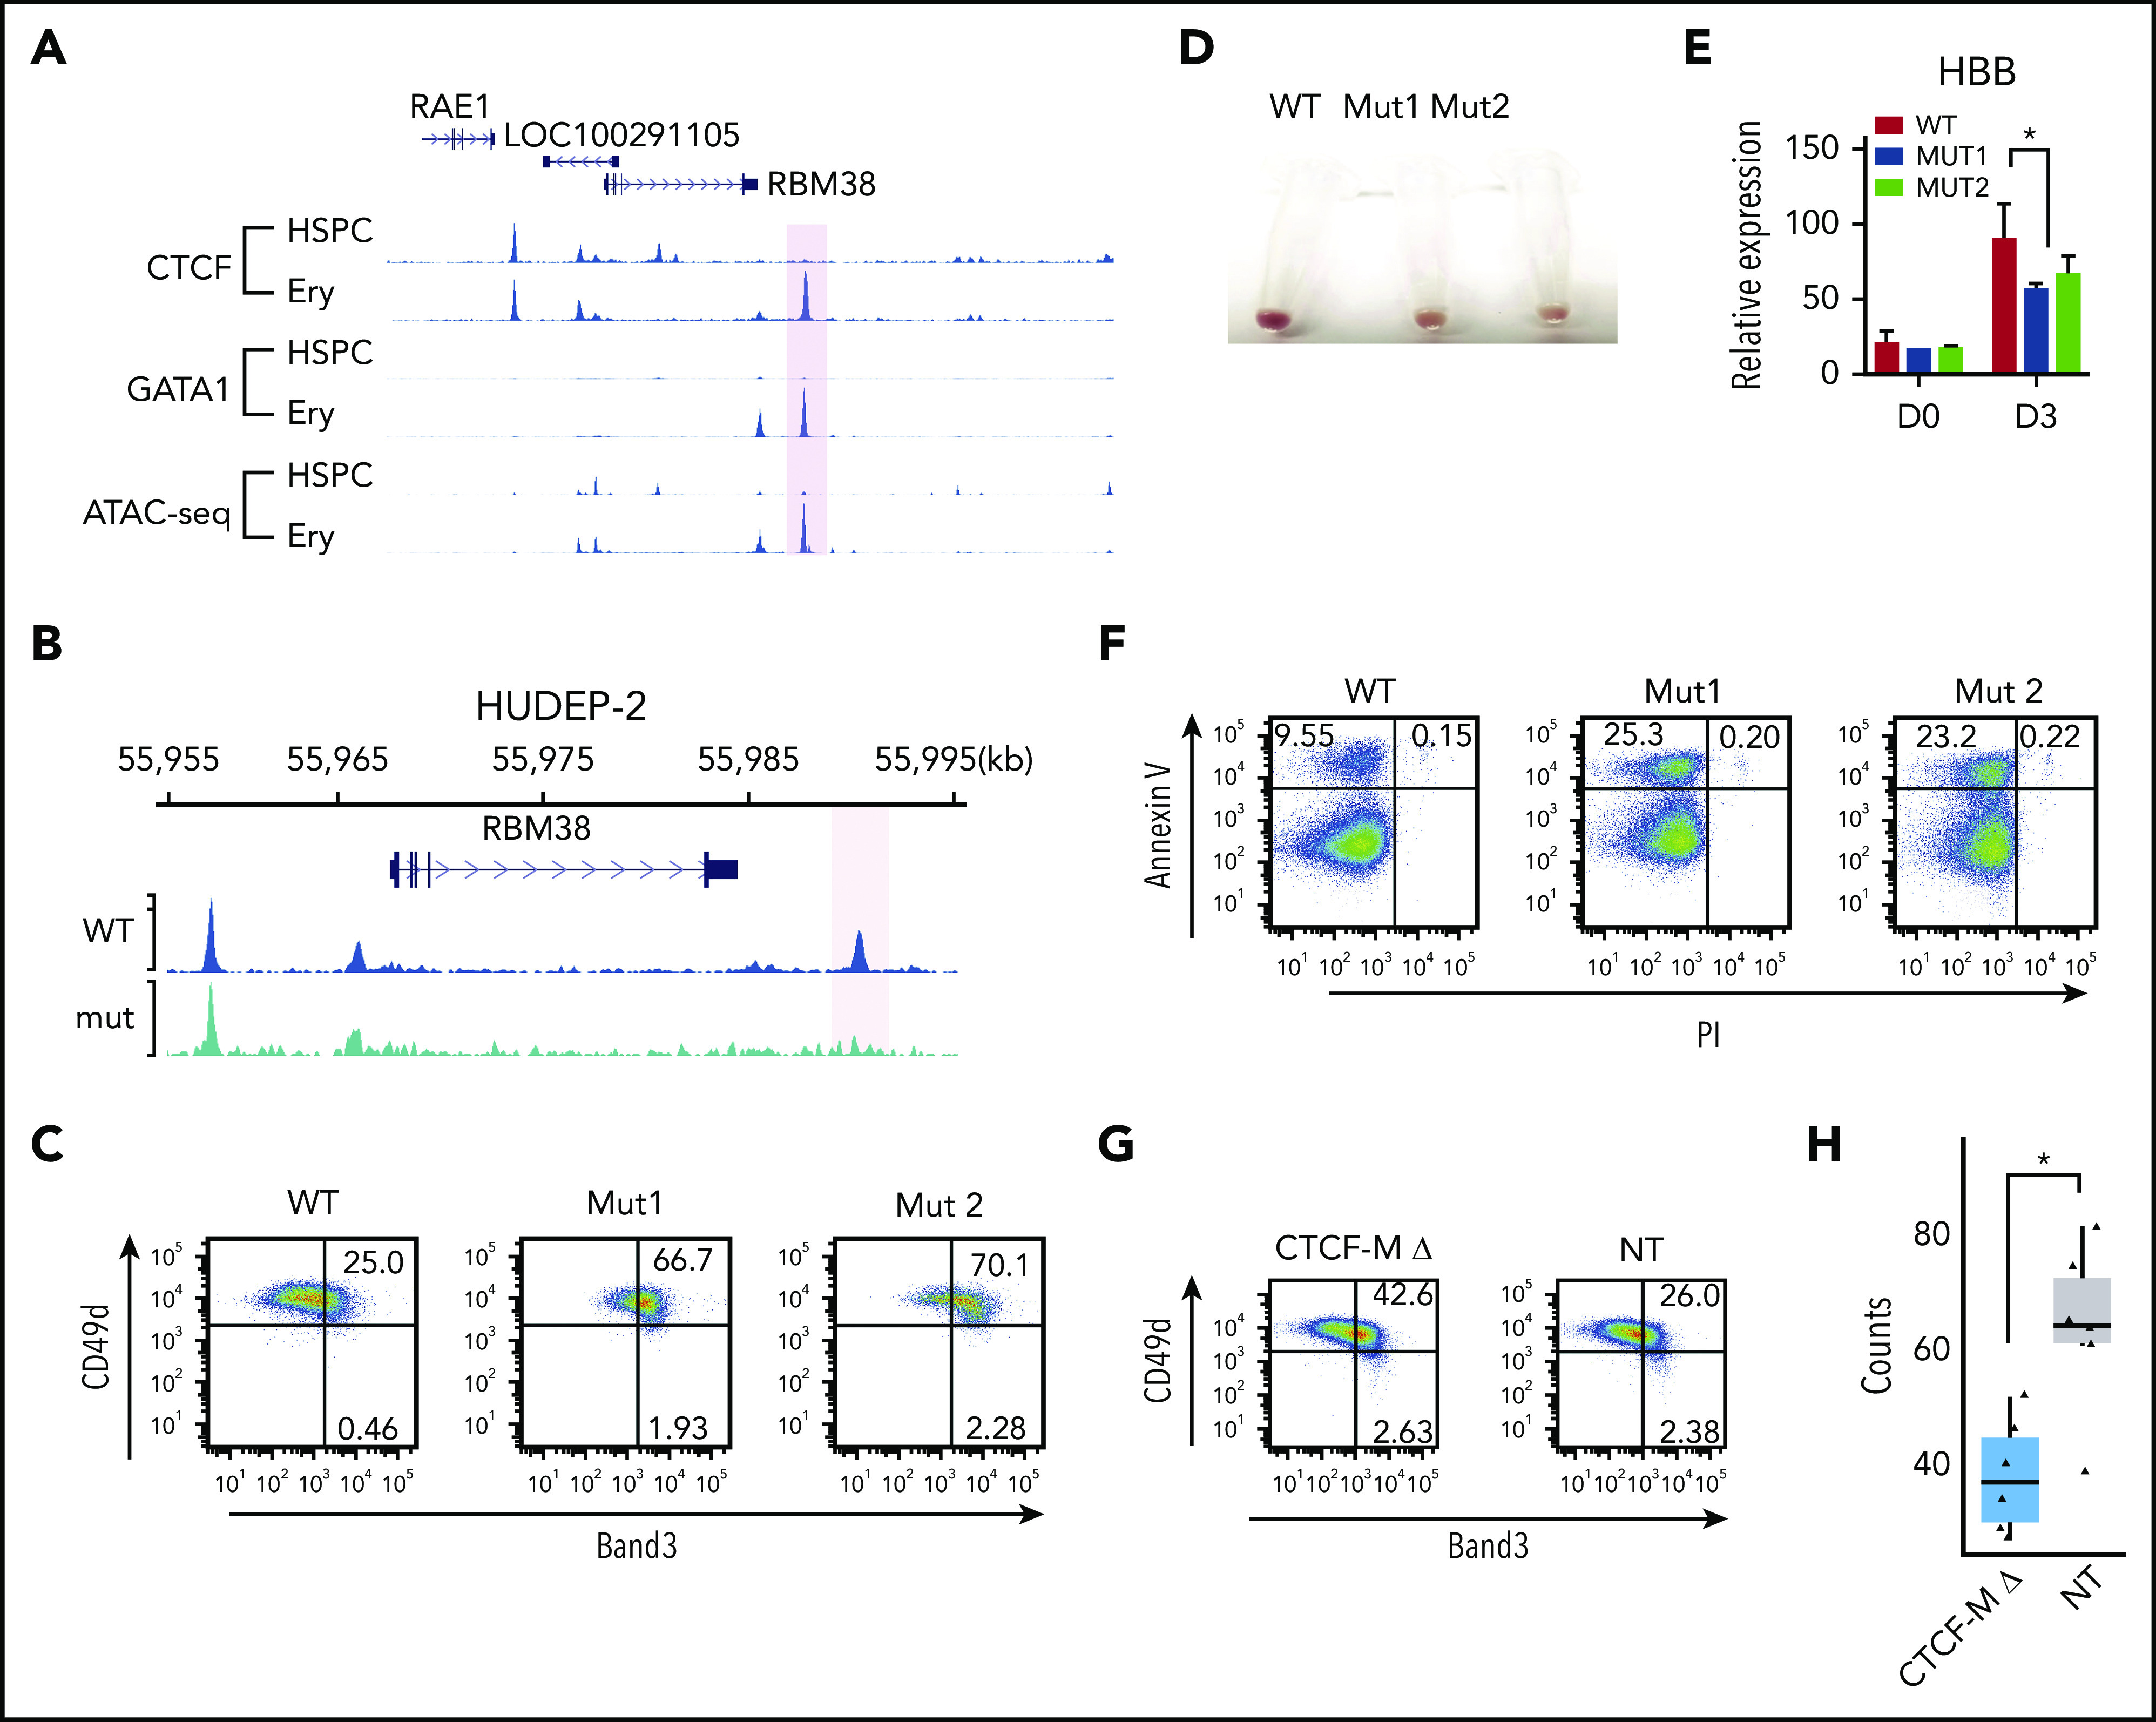
Disrupting dynamic CTCF binding leads to abnormal hematopoiesis. (A) Signal tracks for CTCF and GATA1 ChIP-seq and ATAC-seq at the RBM38 gene locus in HSPCs and erythroblasts. The dynamic site that was genome edited to remove the CTCF motif is highlighted. (B) CTCF ChIP-seq signals in WT HUDEP-2 cells (WT) and HUDEP-2 cells with a 19-bp deletion of the CTCF motif near RBM38 promoter (mut) after 3 days of inducted erythroid maturation. The dynamic CTCF site that harbors the deleted motif is highlighted. (C) Representative flow cytometric plot of Band3 and CD49d expression in gated CD235a+ WT HUDEP-2 cells and 2 mut clones after 3 days of induced maturation. (D) Cell pellets of WT HUDEP-2 cells and 2 mut clones after 4 days of induced maturation. (E) Relative expression level of HBB in WT HUDEP-2 cells and 2 mut clones, as compared with GAPDH before differentiation (D0) and 3 days after induced maturation (D3). D0, n = 2; D3, n > 3. *P < .05, paired 1-tailed t test. (F) Representative flow cytometric plot of annexin V and propidium iodide expression in WT HUDEP-2 cells and 2 mut clones after 3 days of induced maturation. (G) Genome-edited CD34+ cells were grown in erythroid differentiation medium for 12 days. Representative flow cytometric plots of Band3 and CD49d levels in gated CD235a+ cells. (H) Genome-edited CD34+ cells were seeded onto methylcellulose. Box plot shows the numbers of burst-forming unit–erythroid colonies after 14 days in culture. n = 6, *P < .01, unpaired 2-tailed t test. NT, nontargeting control gRNA; PI, propidium iodide.
