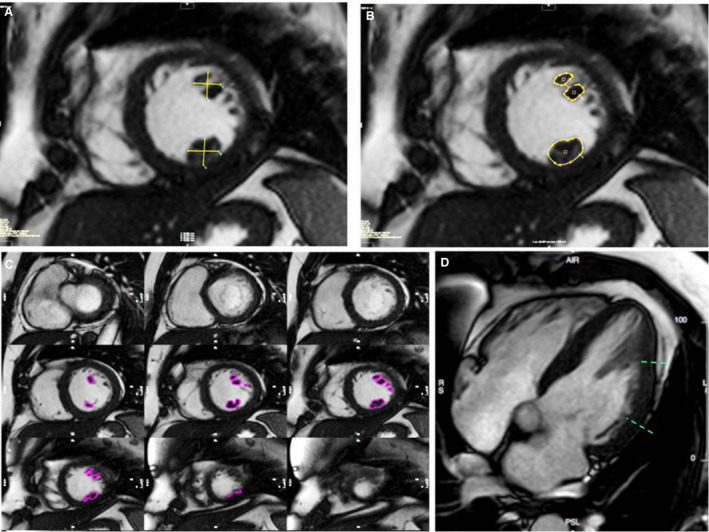
Figure 1. Papillary muscles hypertrophy quantitative analysis.

A, Linear quantification of orthogonal diameters of anterolateral and posteromedial papillary muscles. B, Papillary muscles area quantification in the same slice. C, Papillary muscles volume analysis in the entire stack of short‐axis views. D, Apical displacement assessment in long axis view.
