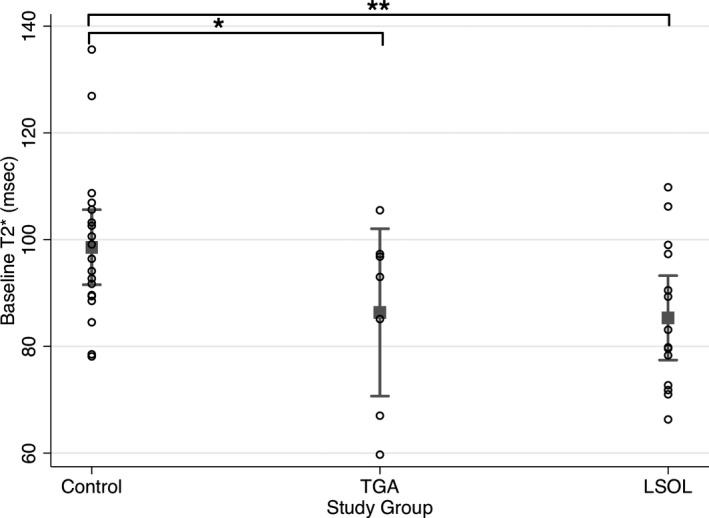
Figure 3. T2* values at baseline for the control, LSOL, and TGA groups with mean and 95% CI.

At baseline, cerebral tissue oxygenation (T2*) is significantly lower in LSOL (**coeff:−15.4, 95% CI, −25.3 to −5.5, P=0.003) and TGA (*coeff: −12.0, 95% CI, −24.4 to 0.4, P=0.05) compared with the control group after adjusting for gestational age at MRI. LSOL indicates left‐sided obstructive lesions; MRI, magnetic resonance imaging; and TGA, transposition of the great arteries.
