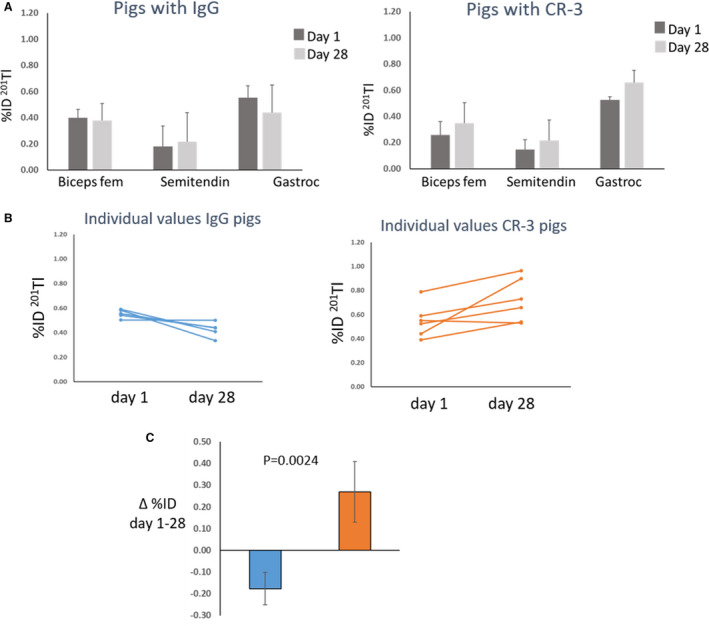
Figure 2. Effect of treatment on perfusion.

(A) Bars represent hind limb muscle perfusion measured as mean±SD uptake of 201Tl (percentage injected dose [%ID]) for diabetic pigs treated with IgG (n=5) and anti–receptor for advanced glycation end products antibody (CR‐3) (n=6) at day 1 (dark gray bars) and day 28 (light gray bars). (B) Individual values for gastrocnemius (Gastroc) muscle perfusion at day 1 and day 28 for IgG treated pigs (blue) and CR‐3 treated pigs (orange). (C) Each bar represents change in Gastroc muscle perfusion as mean±SD between days 1 and 28 for IgG treated pigs (blue bar) and CR‐3 treated pigs (orange bar). Biceps fem indicates biceps femoris; and Semitendin, semitendinosus.
