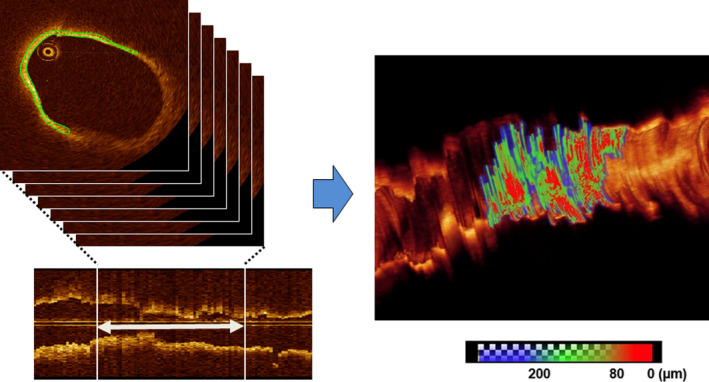
Figure 1. Three‐dimensional thin‐cap area measurement.

The fibrous cap (FC) was semiautomatically segmented by the algorithm in all frames along the entire plaque. The algorithm quantified the thickness at each point of its luminal boundary with the fully segmented FC. The FC area was calculated as the product of the frame interval and the arc length of the FC summed over all the involved frames. The area with FC thickness <200 µm was considered thin‐cap area (combined green and red areas in the right panel).
