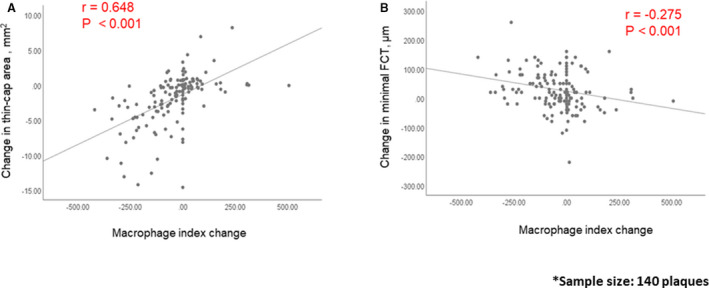
Figure 3. Correlation between changes in macrophage index and changes in fibrous cap.

Significant correlations between the change in macrophage index and the change in thin‐cap area (A), or fibrous cap thickness (FCT) (B) were observed. Sample size: 140 plaques.
