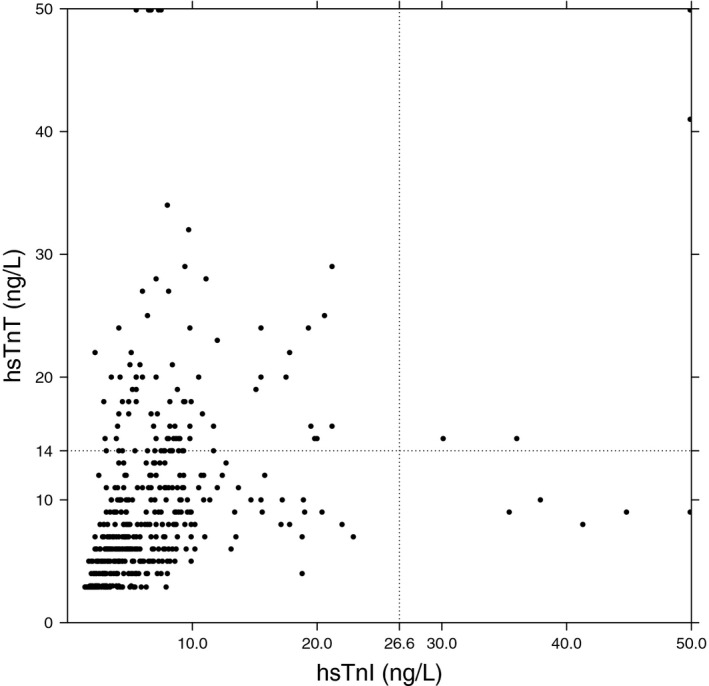
Figure 2. Comparison of high‐sensitivity cardiac troponin I and T concentrations in the samples taken after 6 months.

The x axis depict the hs‐cTnI concentration, while on the y axis the concentration of hs‐cTnT is given. Each dot represents a single blood sample in which thus both an hs‐cTnI and hs‐cTnT concentration has been measured. hs‐cTnI indicates high‐sensitivity cardiac troponin I; and hs‐cTnT, high‐sensitivity cardiac troponin T.
