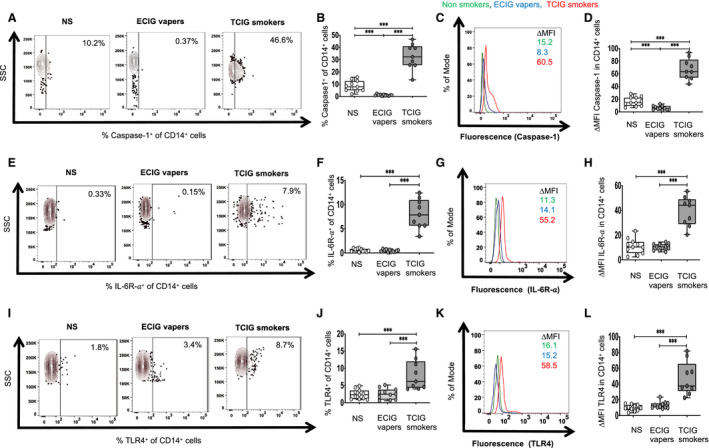
Figure 1. Protein levels of toll‐like receptor 4 (TLR4), caspase 1, and interleukin 6 receptor α (IL‐6R‐α) in CD14+ monocytes among smoker groups.

A through L, Flow cytometry was used to determine membrane protein levels of TLR4 and IL‐6R‐α and intracellular protein levels of caspase‐1. Fluorescence intensity of a positive cell population was compared with a negative cell population (fluorescence minus 1 negative control for staining) (∆MFI). The compared groups were nonsmokers (NS, white), electronic‐cigarette vapers (ECIG vapers, light grey), and tobacco cigarette smokers (TCIG smokers, dark grey). Representative data of percentage of CD14+ monocytes that had positive staining for each protein between compared groups are shown for caspase 1 (A), IL‐6R‐α (E), and TLR4 (I). Summary of data for caspase 1 (B), IL‐6R‐α (F), and TLR4 (J) are shown. Representative data of ∆MFI of caspase 1 (C), IL‐6R‐α (G), and TLR4 (K) in CD14+ monocytes. Summary of data for ∆MFI of caspase 1 (D), IL‐6R‐α (H), and TLR4 (L) are shown. Kruskal‐Wallis ANOVA was used to compare the 3 groups and, if the results were statistically significant (P<0.05), then the Mann‐Whitney test was used to compare individual 2 groups (***P<0.001).
